
Introduction
Beyond vulnerability scanning
How can a system's exposure to successful cyberattacks be detected accurately? It is not possible through vulnerability scanning alone. Security testing by pentesters (i.e., pentesting) is still necessary. Although automated tools have become indispensable for identifying potential vulnerabilities due to their processing power and speed, they have high false positive and false negative rates, usually finding less than half of the applications' risk exposure. Part of the reason for this is that tools cannot detect vulnerabilities when their discovery involves a complex and unexpected use of the software products by an external user. This is where the expertise of pentesters comes into play.
Recognizing in advance, from our business experience, the superiority of pentesting over vulnerability scanning (both part of the spectrum of application security testing, AST), we sought to confirm this idea with a study involving multiple third-party tools, not just our own. We initially defined a target of evaluation and then some tools to test. We paid attention to their findings, including true positives, false positives, and false negatives, and determined F-scores. In addition to highlighting the identified vulnerabilities, we emphasized the risk exposure(CVSSF) detected.
CVSSF is a metric we established to overcome limitations of the CVSS score, such as segmentation, aggregation, and comparison, and to better contribute to vulnerability prioritization. For example, ten vulnerabilities of severity 1.0 do not equal one vulnerability of severity 10.0. From the equation CVSSF = 4 ^ (CVSS - 4), we can determine values with much more marked differences that better reflect the reality of the risks. Accordingly, for the vulnerabilities in the example, the results in units of CVSSF would be 0.2 (i.e., 10 x 0.02) and 4,096 (i.e., 1 x 4,096), respectively.
Methodology
Measuring accuracy in vulnerability detection
STARTING DATE
2023
December
Evaluators
36 third-party tools* |(open source or demo/free trial) for SAST, DAST and/or SCA (some of these tools are included in the Gartner Magic Quadrant)
Fluid Attacks' tool for SAST, SCA and DAST (from now on “our scanner”)
Fluid Attacks' pentester
Target of evaluation (ToE*)
A modern, realistic and vulnerable-by-default web application with the following characteristics:
Model-view-controller (MVC)
Single-page application (SPA)
RESTful API
In NodeJS, mainly with TypeScript
*For security and confidentiality reasons, the names of the tools and ToE were anonymized (the tools follow an alphabetical order from "A" to "Z" and from "AA" to "AJ").
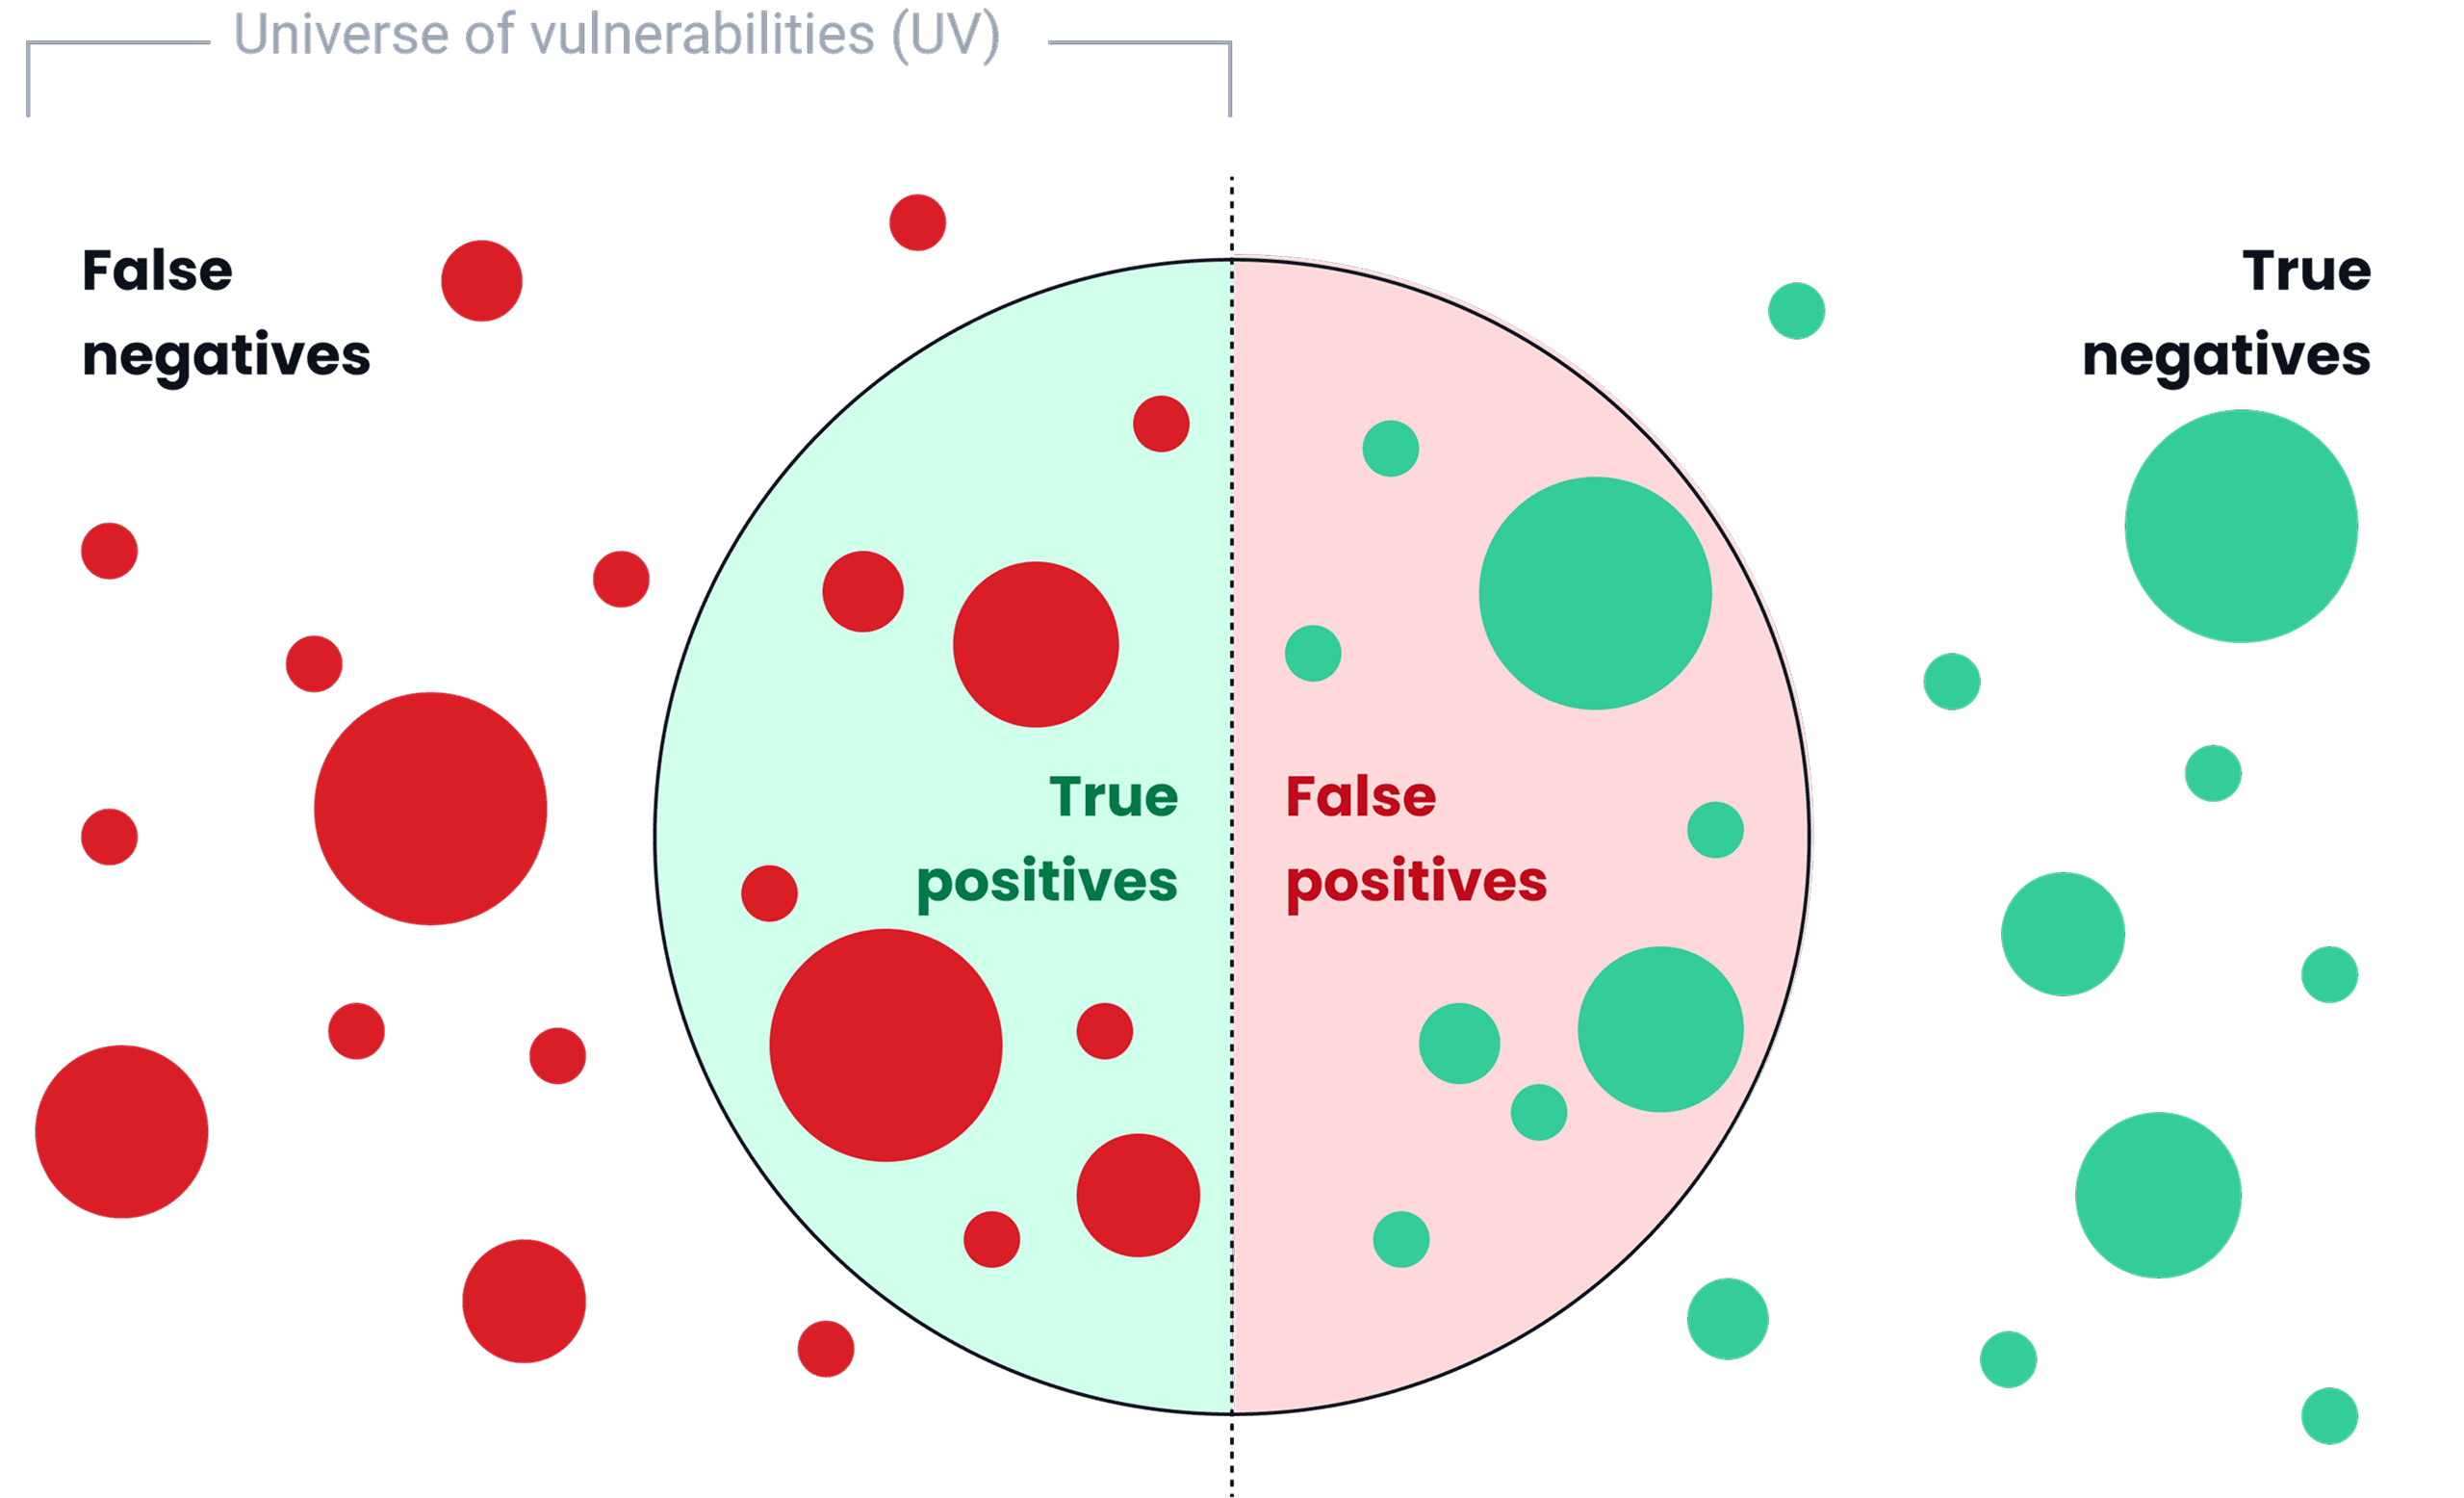
Universe of vulnerabilities
**Our team (scanner and pentester) detected 93.9% of the universe of vulnerabilities (UV); some external tools identified the remaining percentage.
1,201
vulnerabilities
105
CWE categories
461,500
CVSSF units
80%
in the codebase, 13% in the backend, and the rest in dependencies and frontend.
73.2%
required authentication.
Data analysis
F1 is the harmonic mean of both variables, while F0.5 gives more importance to precision than to recall, and F2 gives more importance to recall than to precision.
From the true positives (TP) and false positives (FP), we determined the precision (“how many identified elements are relevant?”) and recall (“how many relevant elements are identified?”) values:

Then, we established relationships between these two variables through the F-score:
Fᵦ = (1 + β²) · {[precision · recall] / [(β² · precision) + recall]}
Results
Rethinking security assessment
Top 10 for TPs, precision and recall
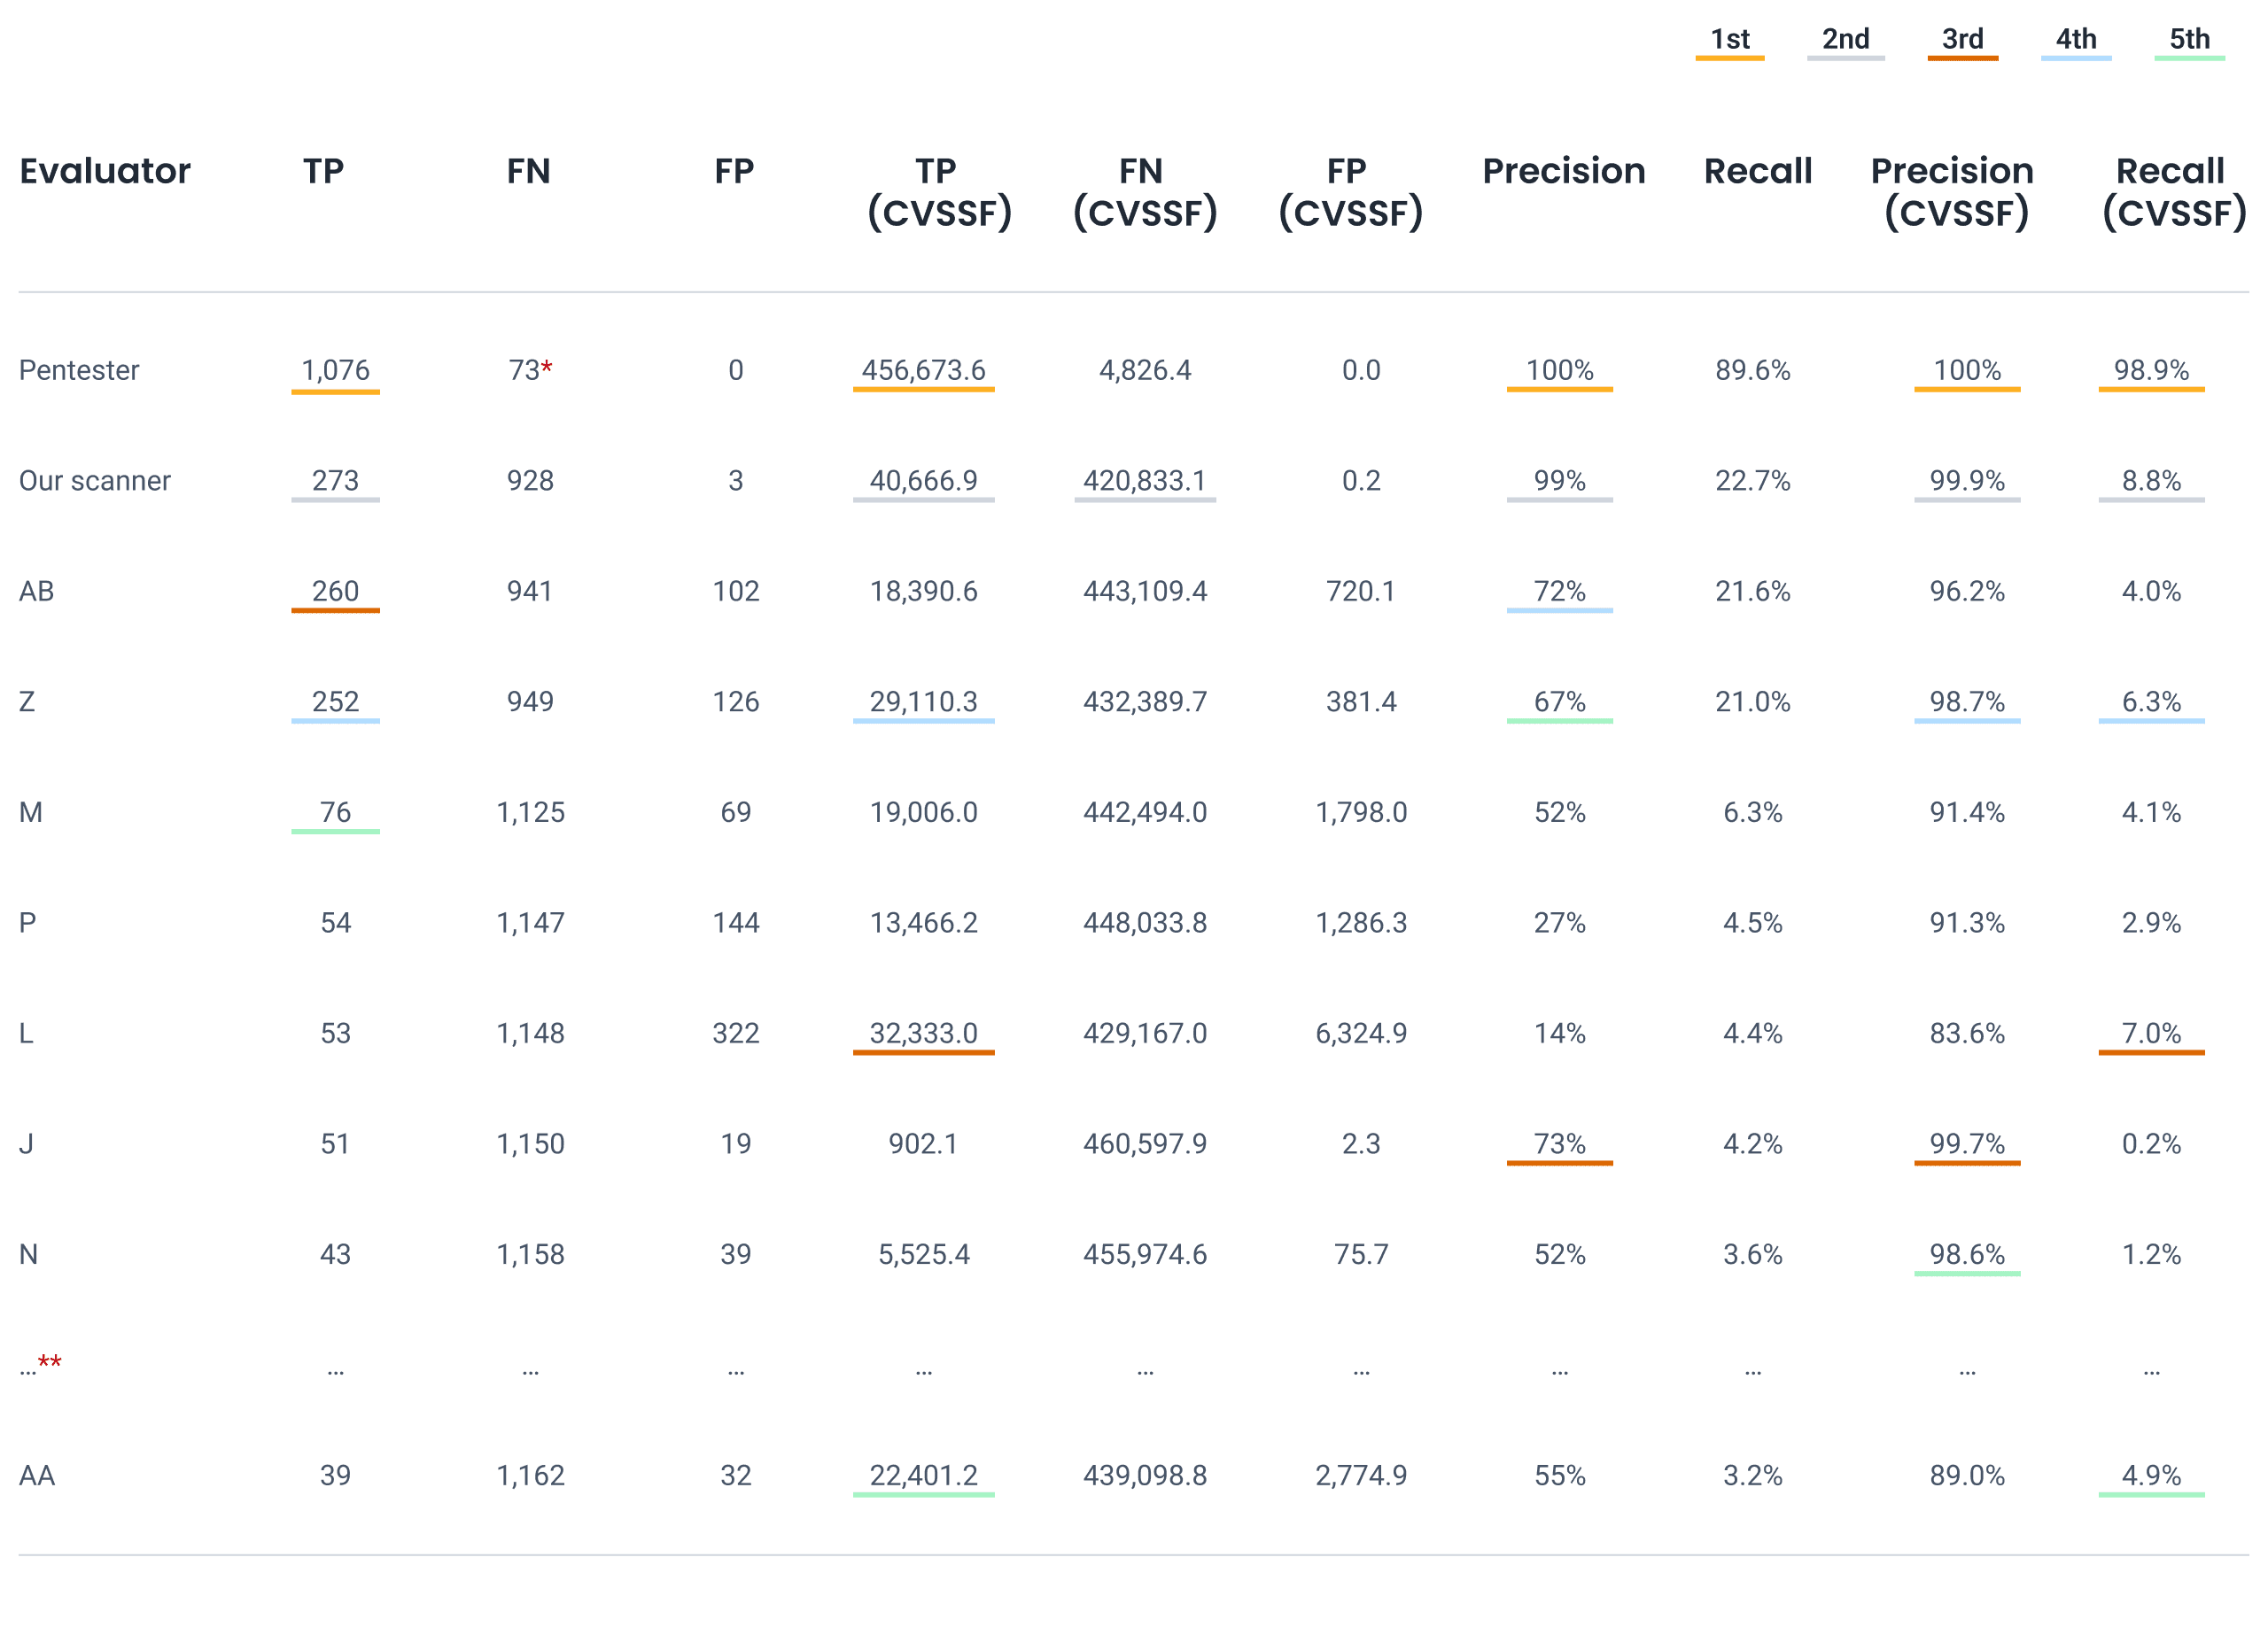
*This value is not 125 (value necessary to complete, in sum with the TPs, the UV) because in the methodology we defined that the pentester would not review sections already evaluated by our scanner.
**In this table are listed, apart from the pentester, only the tools that ranked in the top 4 in the highlighted metrics.
The tool that identified the highest percentage of vulnerabilities (i.e., our scanner) detected 22.7%, corresponding to only 8.8% of the ToE’s total risk exposure (CVSSF).
Among the tools in this table, our scanner was very close to the pentester in FPs, with only three. Out of all the tools that detected at least 50 vulnerabilities, this was the one with the best precision; indeed, those other six tools had an average of about 130 false positives.
While the best recall values among the automated tools evaluated were between 21% and almost 23%, the average recall among the other 34 tools was an appalling 1.7%. In fact, 17 tools failed to identify even ten vulnerabilities out of the 1,201 present in the ToE.
Even more striking is the recall in terms of CVSSF. As we said, the best tool did not even reach 9%. Still, if we take all the percentages achieved by the 37 tools, assuming they are values corresponding to non-intersecting sets and can be summed, they would not even add up to 60% of the total risk exposure of the ToE. Meanwhile, the pentester managed to detect almost 99%!
Further, 743 of 1,201 vulnerabilities, or 61.9% of the UV, were detected exclusively by the pentester in manual testing, corresponding to 86.8% of the total risk exposure.
Top 5 for F-scores (CVSSF)
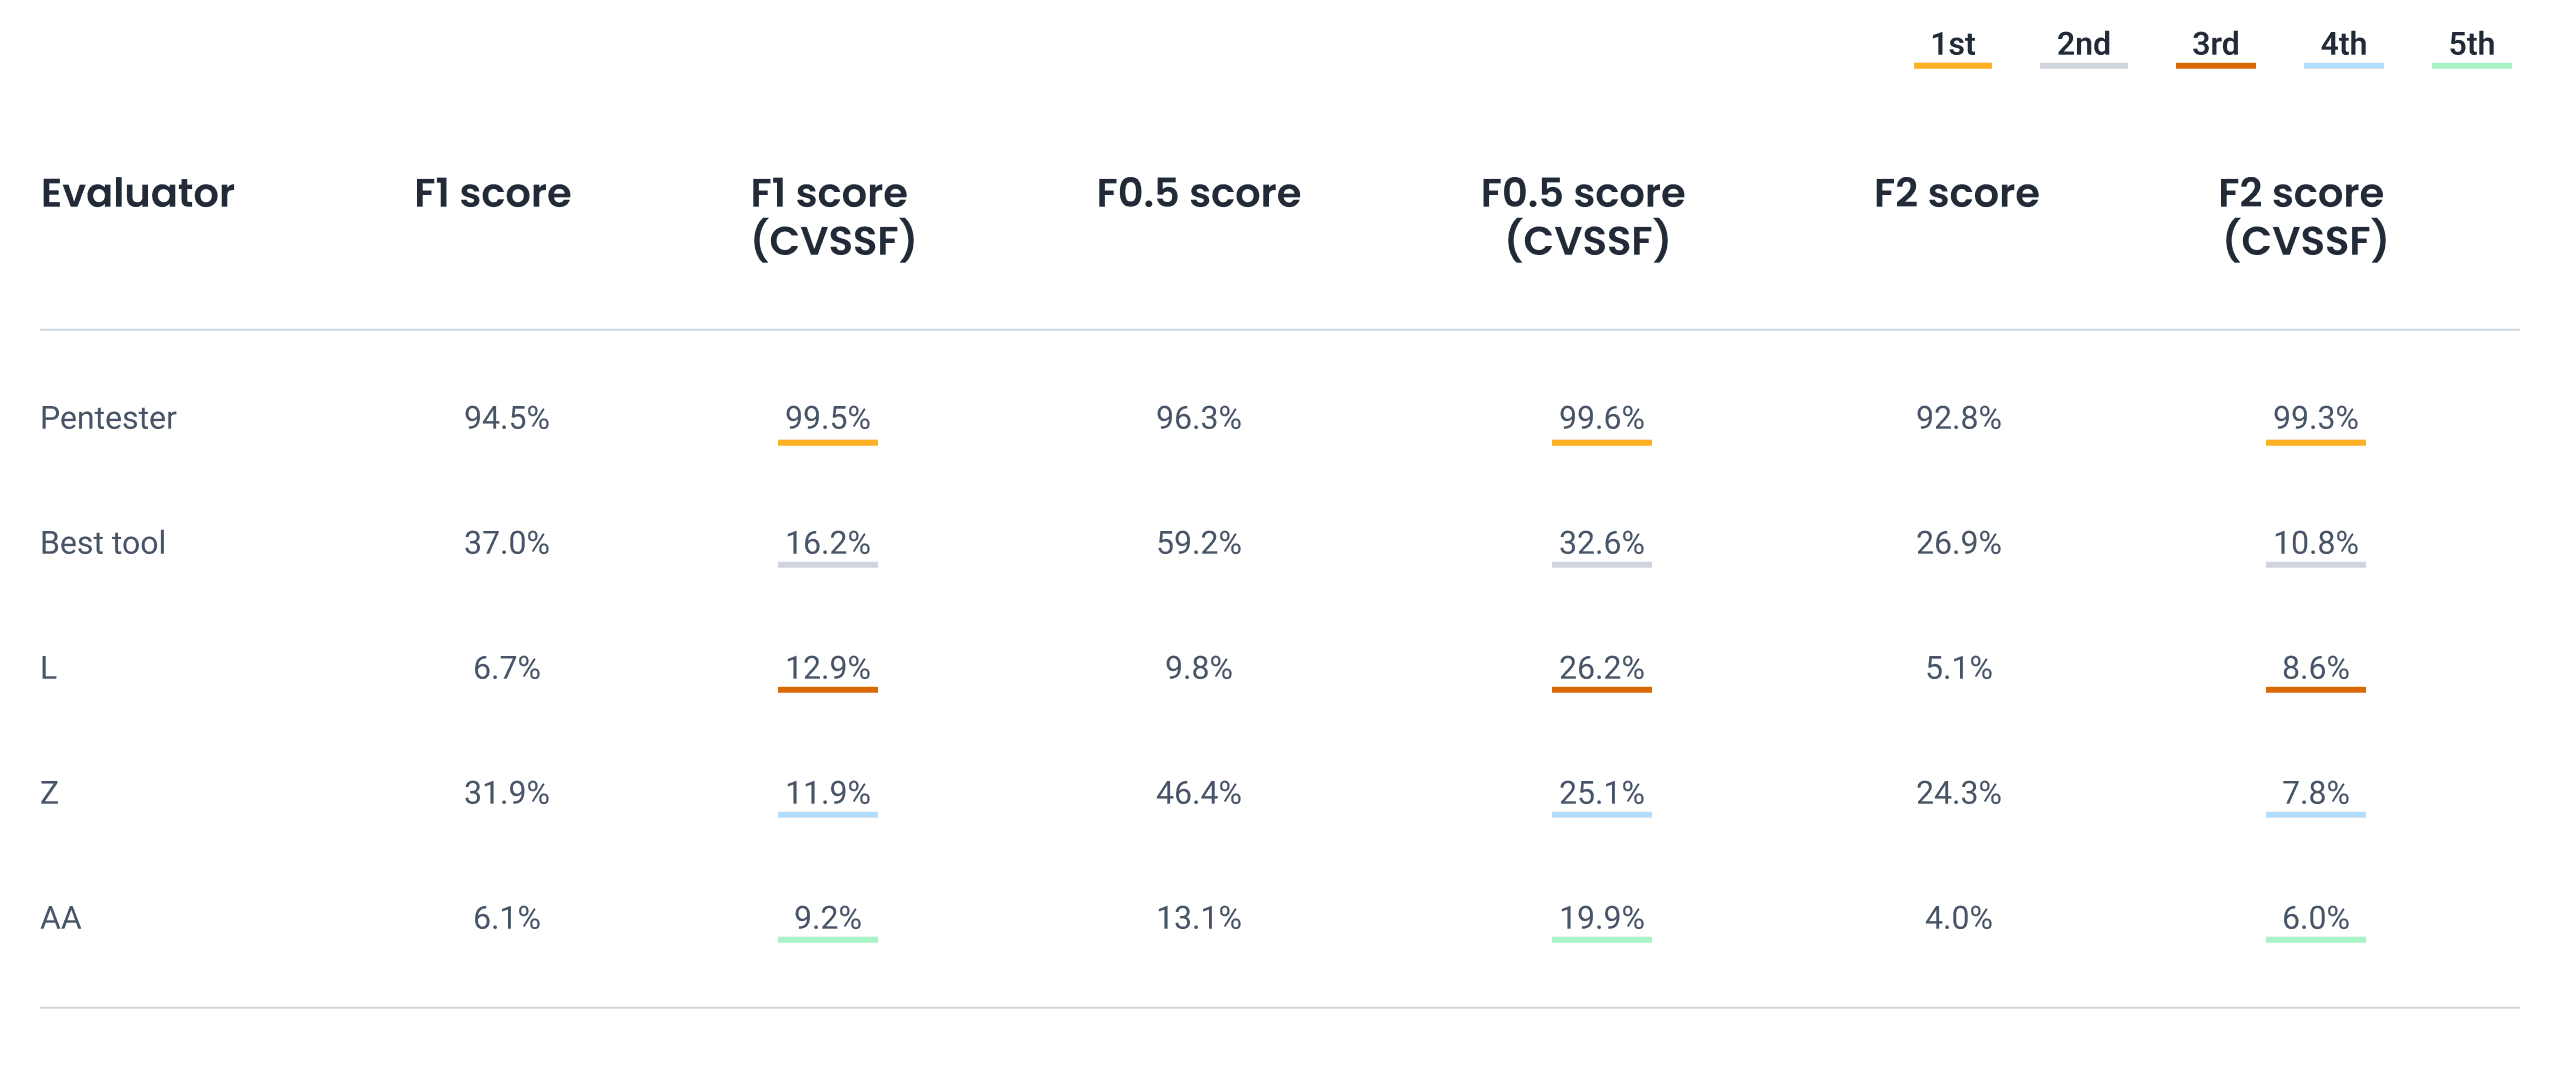
All F-scores (CVSSF) of the pentester surpassed 99%.
Although the F-scores (CVSSF) of our scanner always led with respect to those of the other tools, they were very low compared to the pentester's F-scores. Its best result was an F0.5 score (CVSSF) of 32.6%, a value that gives more relevance to precision than to recall. Although this F0.5 represented almost a third of what the pentester achieved, it was twice the average F0.5 of the next ten tools in that top.
The F2 scores (CVSSF) were consistently lower than the F0.5 scores (CVSSF). The averages of these two values for all automated tools were 1.9% and 6.3%, respectively, reflecting the preponderance of precision over recall.
F0.5 vs F1 vs F2 scores (CVSSF)
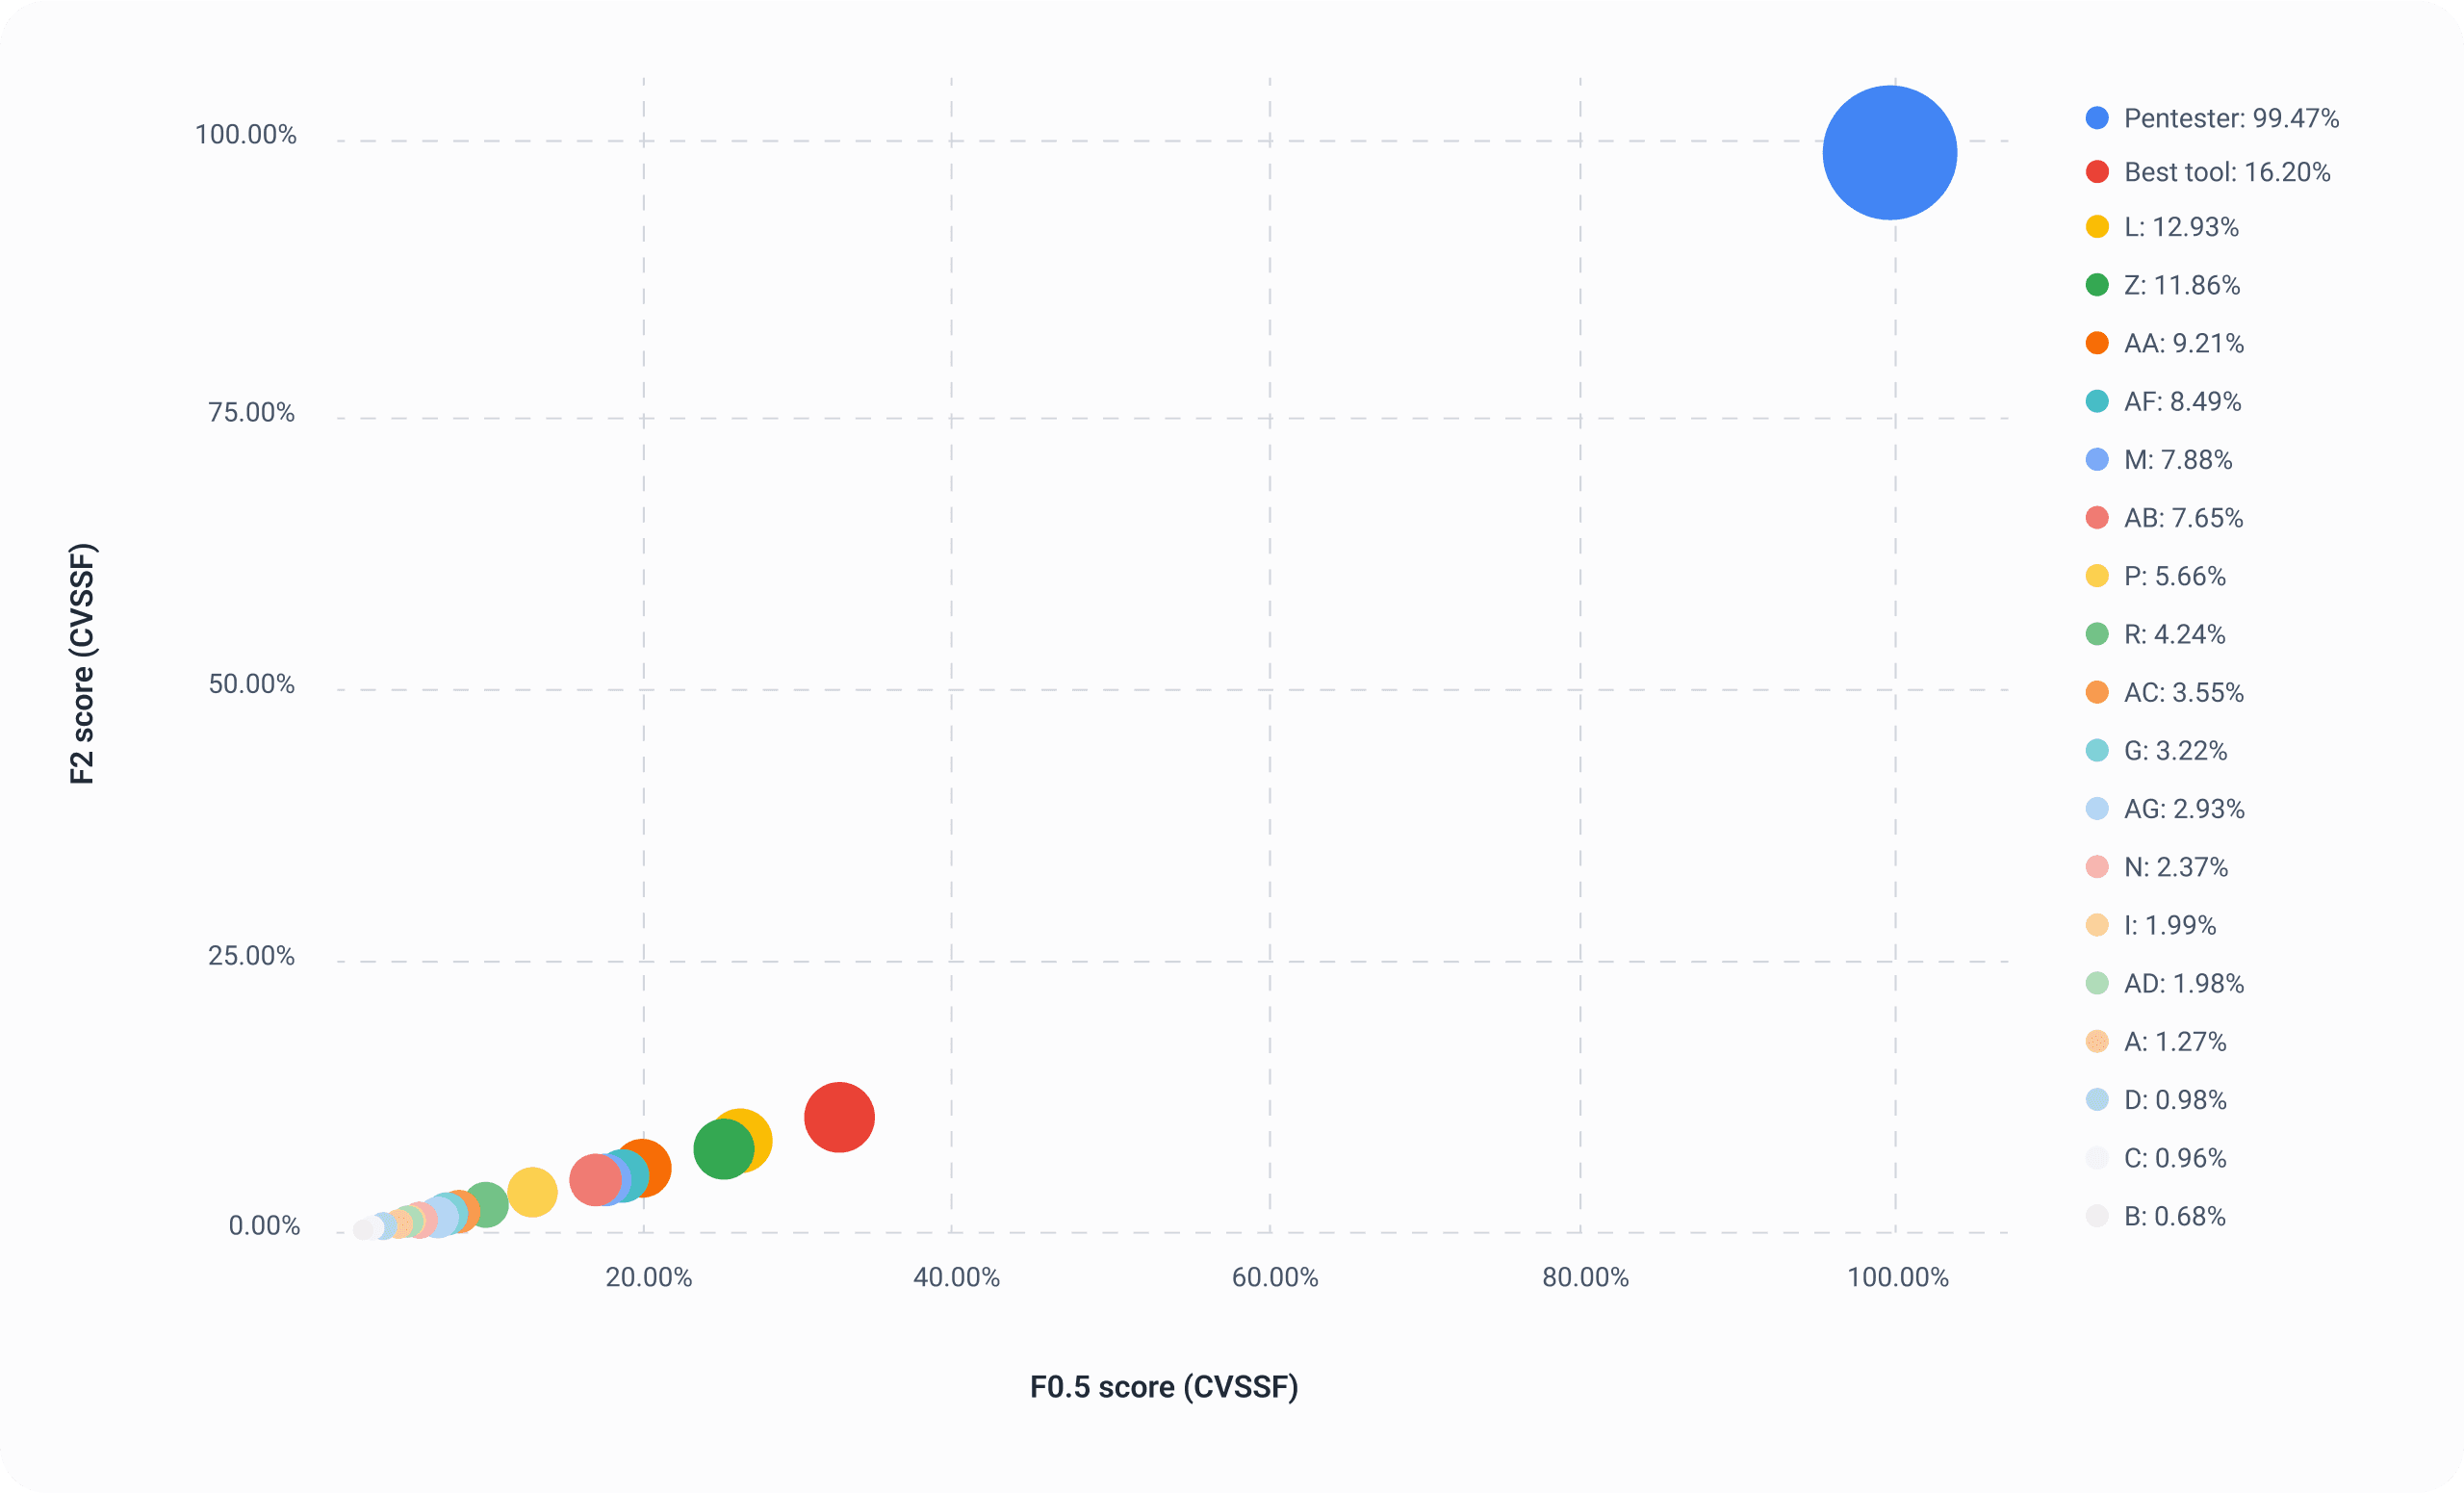
The size of the bubble represents the magnitude of the F1 score (CVSSF). The closer a tool is to the upper right quadrant, the better its performance.
Execution time by evaluator
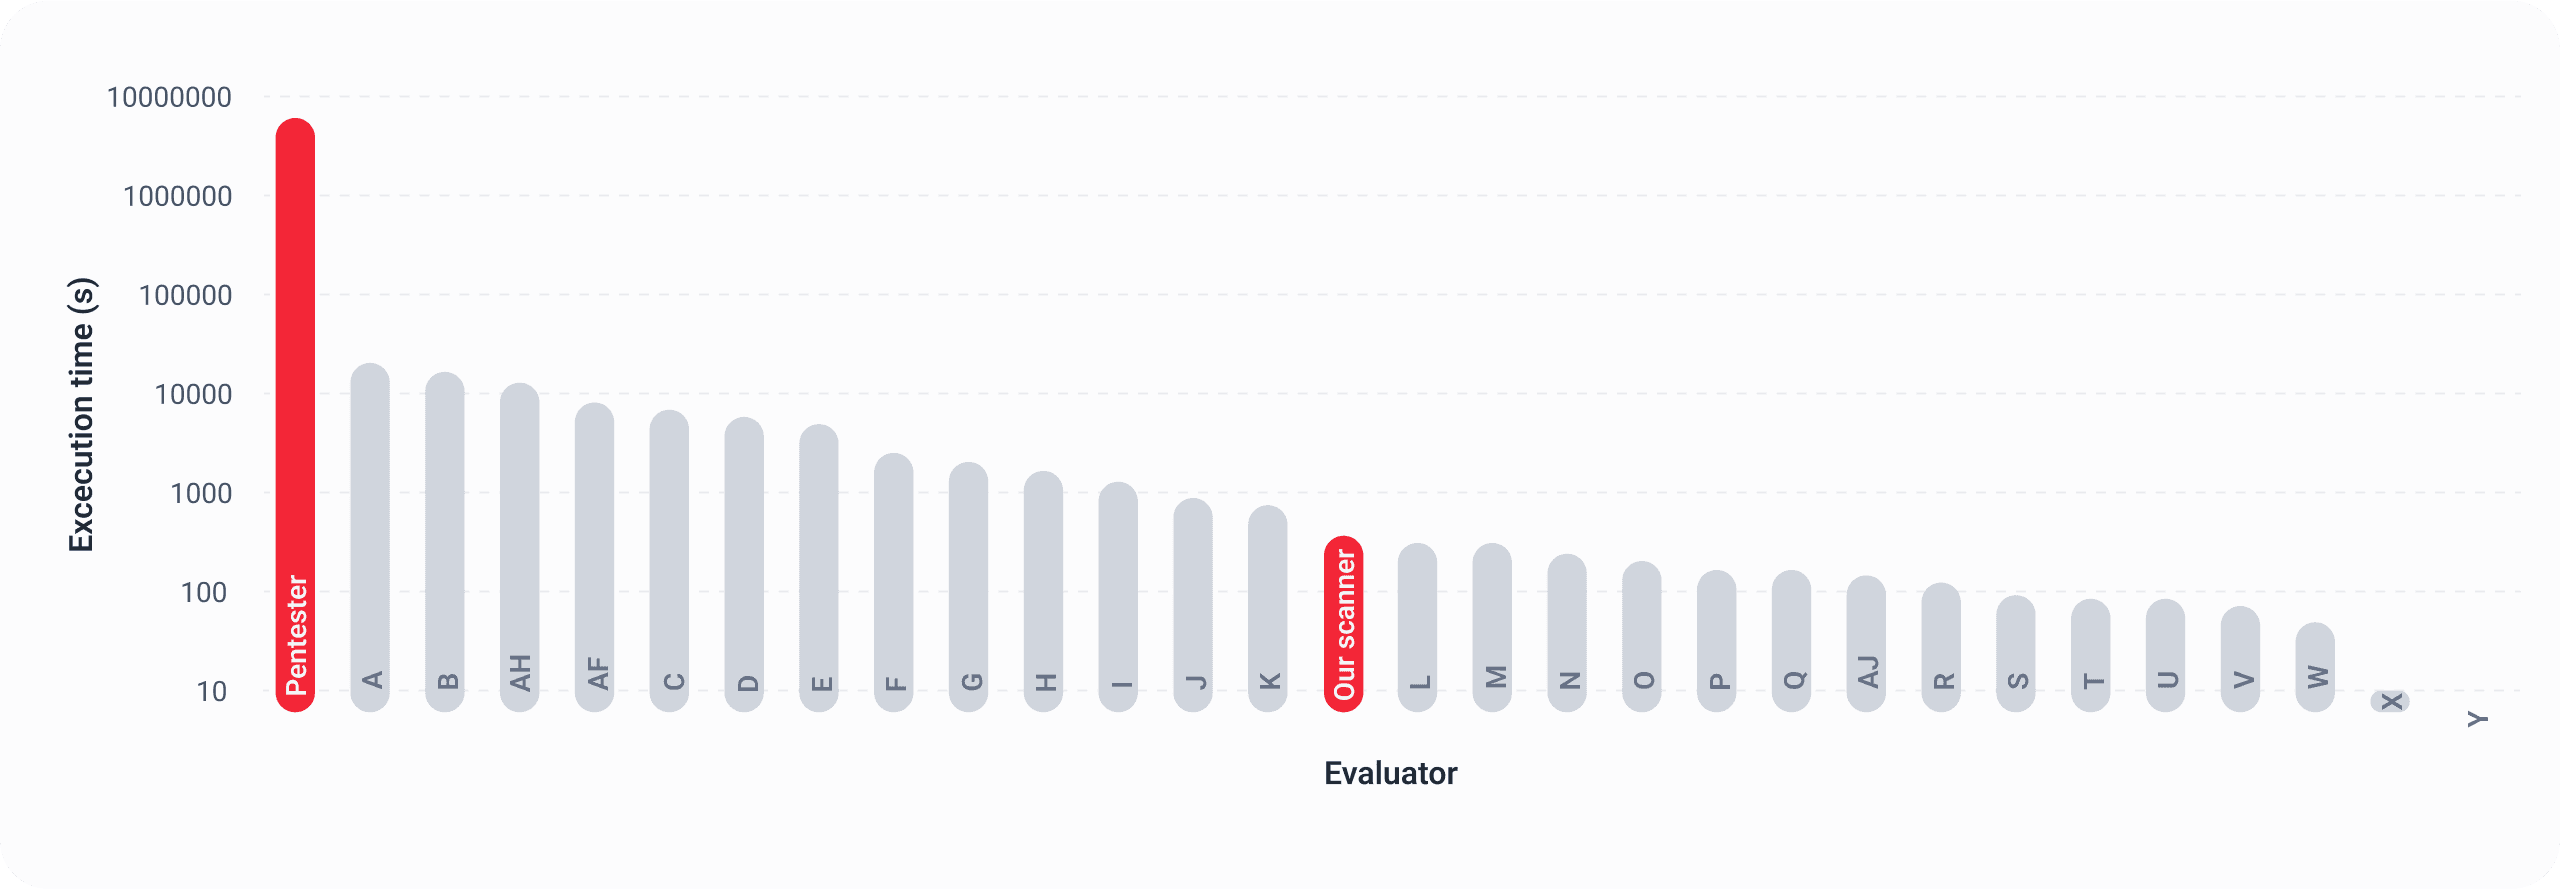
The difference between the pentester's and the automated tools' execution times was overwhelming. If we add up the times collected for the tools (we were unable to record times for eight of them), we find that the total is not even 2% of the time spent by the pentester (49 days). Their average time was 2,652 seconds (i.e., just over 44 minutes). Hence, the importance we usually attach to vulnerability scanning (i.e., security testing by automated tools).
No pattern was found when comparing the F-scores with the execution times. For example, ideally, as the ToE evaluation times increase, the F1 scores of the tools should grow. But if we take as a central reference point the F1 score of 37% achieved by our scanner in 429 seconds, we find that to its right, with shorter run times, the average F1 was 3.5%, while to its left, with longer run times, the average F1 was 2.3% (both sides with almost the same number of tools).
Conclusions
Combining automated and manual testing is the ideal approach
Automated tools are pretty fast in assessing application security, but their false positive rates are often high, although not as high as their false negative rates.
The pentester's precision and recall are much higher but require a much greater investment of time. However, this can change considerably when the ToE is evaluated by an entire team of pentesters and not just one expert (as was the case for this study).
Multiple security vulnerabilities can go unnoticed by automated tools, so supplementing their work with continuous manual testing is indispensable. However, it is not only a question of detecting a higher number of vulnerabilities but, above all, of discovering those that, often more complex, represent the most critical risks for organizations and their users.
A good tool will provide speed and acceptable results from the beginning of the software development lifecycle, but continuous pentesting will significantly boost the accuracy of application security testing. For this reason, it is best for a responsible company with a mature security posture to work with both of them.
Although this study was limited to a single ToE, Fluid Attacks will continue this type of research. We will soon add new targets that will allow us to continue emphasizing the need to integrate tools with humans.
Fluid Attacks offers a comprehensive ASPM solution that enables its customers to identify, prioritize, and remediate security vulnerabilities in their products throughout the SDLC. Security testing is performed by automated tools, AI a team of pentesters, reporting on a single platform with various integrations, which facilitates risk-based vulnerability management. GenAI supports vulnerability remediation, and experts assist in the understanding of complex issues, which significantly contributes to accelerating companies' risk exposure mitigation and strengthening their cybersecurity posture.