ANNUAL REPORT
State of Attacks
2026
Read the findings of one entire year of continuous testing and how they can inspire you to improve your cybersecurity posture.

SECTION 01
Introduction
At Fluid Attacks, we help organizations map and understand their attack surface through continuous security assessments. By combining AI, automated tools, and a team of highly certified pentesters, we uncover vulnerabilities across code and environments, helping companies reduce their risk exposure and strengthen their security posture.
In 2025, we tested our clients' systems and contributed to their security throughout the entire software development lifecycle using our comprehensive solution. When we talk about a "system" in this report, we mean any of the three targets of evaluation or their combination: source code, running application*, and infrastructure.
The State of Attacks 2026 report is our annual look at a full year of security testing data.** It is designed to help you benchmark your organization's security posture and set more effective goals. The patterns we've uncovered can guide you toward more secure development practices and faster remediation, ultimately protecting your users, systems, and data.
Data collection period: January 1 - December 31, 2025
*Throughout this report, we refer to this target simply as "application".
**Due to our recent migration to a new data infrastructure, data shown for the year 2024 might differ from the previous report.
Risk exposure matters more than vulnerability count
As a reminder, having fewer vulnerabilities does not mean greater security; what matters is keeping a low risk exposure. A system with ten vulnerabilities scored at CVSS 1.0 each isn't nearly as risky as a system with a single CVSS 10.0 vulnerability. But raw CVSS scores don't make that comparison easy, which is why we developed the CVSSF metric, our adjustment of the standard CVSS score. It is designed to solve its biggest limitations: poor aggregation and difficulty comparing across systems.
Using our example and the CVSSF equation,* the difference becomes stark and closer to reality. Those ten low-severity vulnerabilities add up to a CVSSF of just 0.2. The single critical vulnerability? A CVSSF of 4,096.
*CVSSF = 4^(CVSS-4)

SECTION 02
Executive summary
Here are the most impactful results
[1]
The vulnerability remediation rate climbed to 62.2% by the end of 2025, a 21.2 percentage point increase over 2024.
[2]
Our GenAI (Autofix and Custom Fix) was used to help with vulnerability remediation in 54% of the systems.
[3]
Our IDE plugin and MCP users remediated on average twice as much as nonusers.
[4]
Exposure increased by 34% and vulnerabilities by 45%, based on median comparisons across all systems.
[5]
The number of systems where we found high- and critical-severity vulnerabilities grew by 26%.
[6]
The mean time to remediate critical vulnerabilities keeps decreasing! This year, it decreased by 18%.
[7]
Teams that used our CI Gate remediated vulnerabilities 27% faster, on average, than those that didn't use it.
[8]
Systems that used our CI Gate achieved a 72% remediation rate, compared to 58% for those that didn't use it.
[9]
Our tools, including our new AI SAST, detected 55.8% of the total risk exposure in the systems assessed.
[10]
Manual testing detected an average of risk exposure 5 times higher compared to the tools.
[11]
While our tools are constantly improving, our pentesters add a vital layer of depth: they detected 90% of risk exposure from critical vulnerabilities.
[12]
Critical vulnerabilities had the best cumulative remediation rate by year's end, with 63.8%.
While AI-driven development is improving remediation efficiency, the attack surface is expanding rapidly in parallel. This trend suggests that despite our gains in speed, the overall volume of new code continues to increase total risk exposure.
SECTION 03
Prominent changes
See key differences compared to the previous report
Risk exposure
In 2025, the risk exposure detected per system increased, with the mean rising 8.5% and the median 33.5%.
8.5%
33.5%
High- and critical-severity vulnerabilities
70% of assessed systems had at least one high- or critical-severity vulnerability—up from 53.3% in 2024.
53.3%
70%
Rating
CVSSv4.0 score
Critical
9.0 - 10.0
High
7.0 - 8.9
Medium
4.0 - 6.9
Low
0.1 - 3.9
None
0.0
Manual vs. automated detection methods
Our tools identified 55.8% of total risk exposure this year, reflecting our continued work improving them. Moreover, our pentesters found most of the riskiest vulnerabilities, reporting 87% of critical-severity findings.
Tools
Pentesters
29.5%
55.8%
70.5%
44.2%
/ Risk exposure
1.1%
13.0%
98.9%
87.0%
/ Critical vulnerabilities
Vulnerability remediation
Mean time to remediate (MTTR) for critical-severity vulnerabilities dropped 17.5%.
17.5%
/ MTTR for critical vulnerabilities
As in previous years, teams that broke the build (i.e., used our CI Gate) remediated faster than those that didn't. This year, the median remediation time for build breakers dropped from 32 days to 21.
Time to remediate: Time elapsed between the reporting of a vulnerability and its remediation.
Break the build: Security control for CI pipelines in which our CI Gate interrupts software deployment whenever there are still unaccepted vulnerabilities in the product.
SECTION 04
General findings
How was the vulnerability and risk exposure landscape in 2025
27,440,146
Reported risk exposure (CVSSF units)
31,041
Mean risk exposure per system
1,119,396
Reported vulnerabilities
1,266
Mean number of vulnerabilities per system
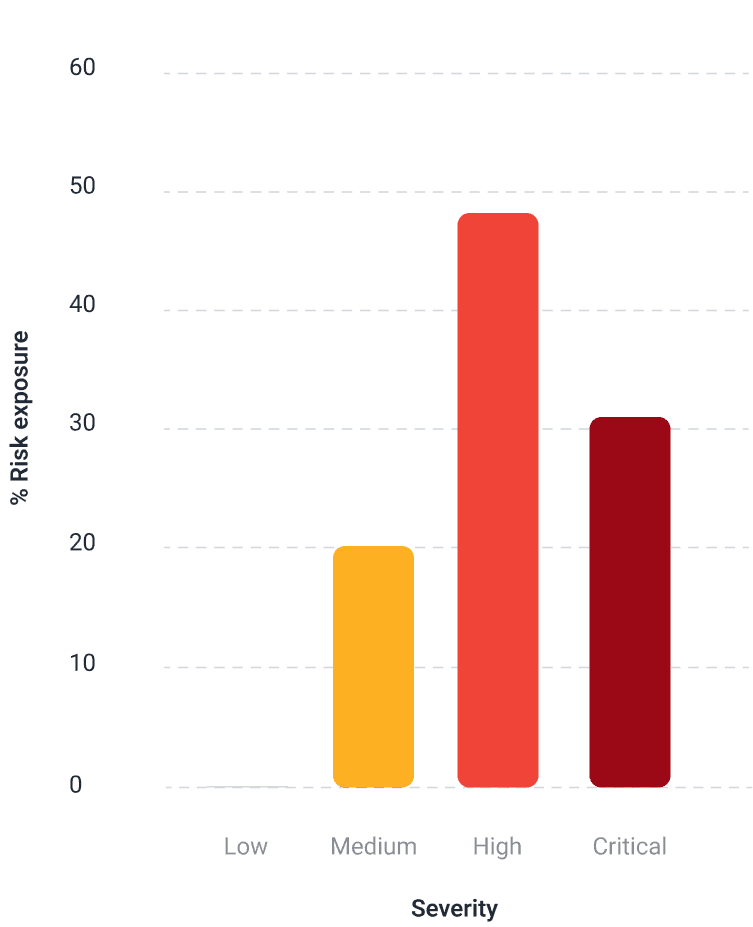
Risk exposure by severity
High- and critical-severity vulnerabilities accounted for 79.9% of total risk exposure. These represent just 4.5% of all vulnerabilities identified, yet they carried 3 times more risk than the remaining 95.5%.
Severity
Total vulnerabilities
Total risk exposure
Critical
5,609
8,666,452.9
High
44,886
13,249,647.1
Medium
261,732
5,494,206.7
Low
807,169
29,839.2
Risk exposure and vulnerabilities by severity
For each target of evaluation
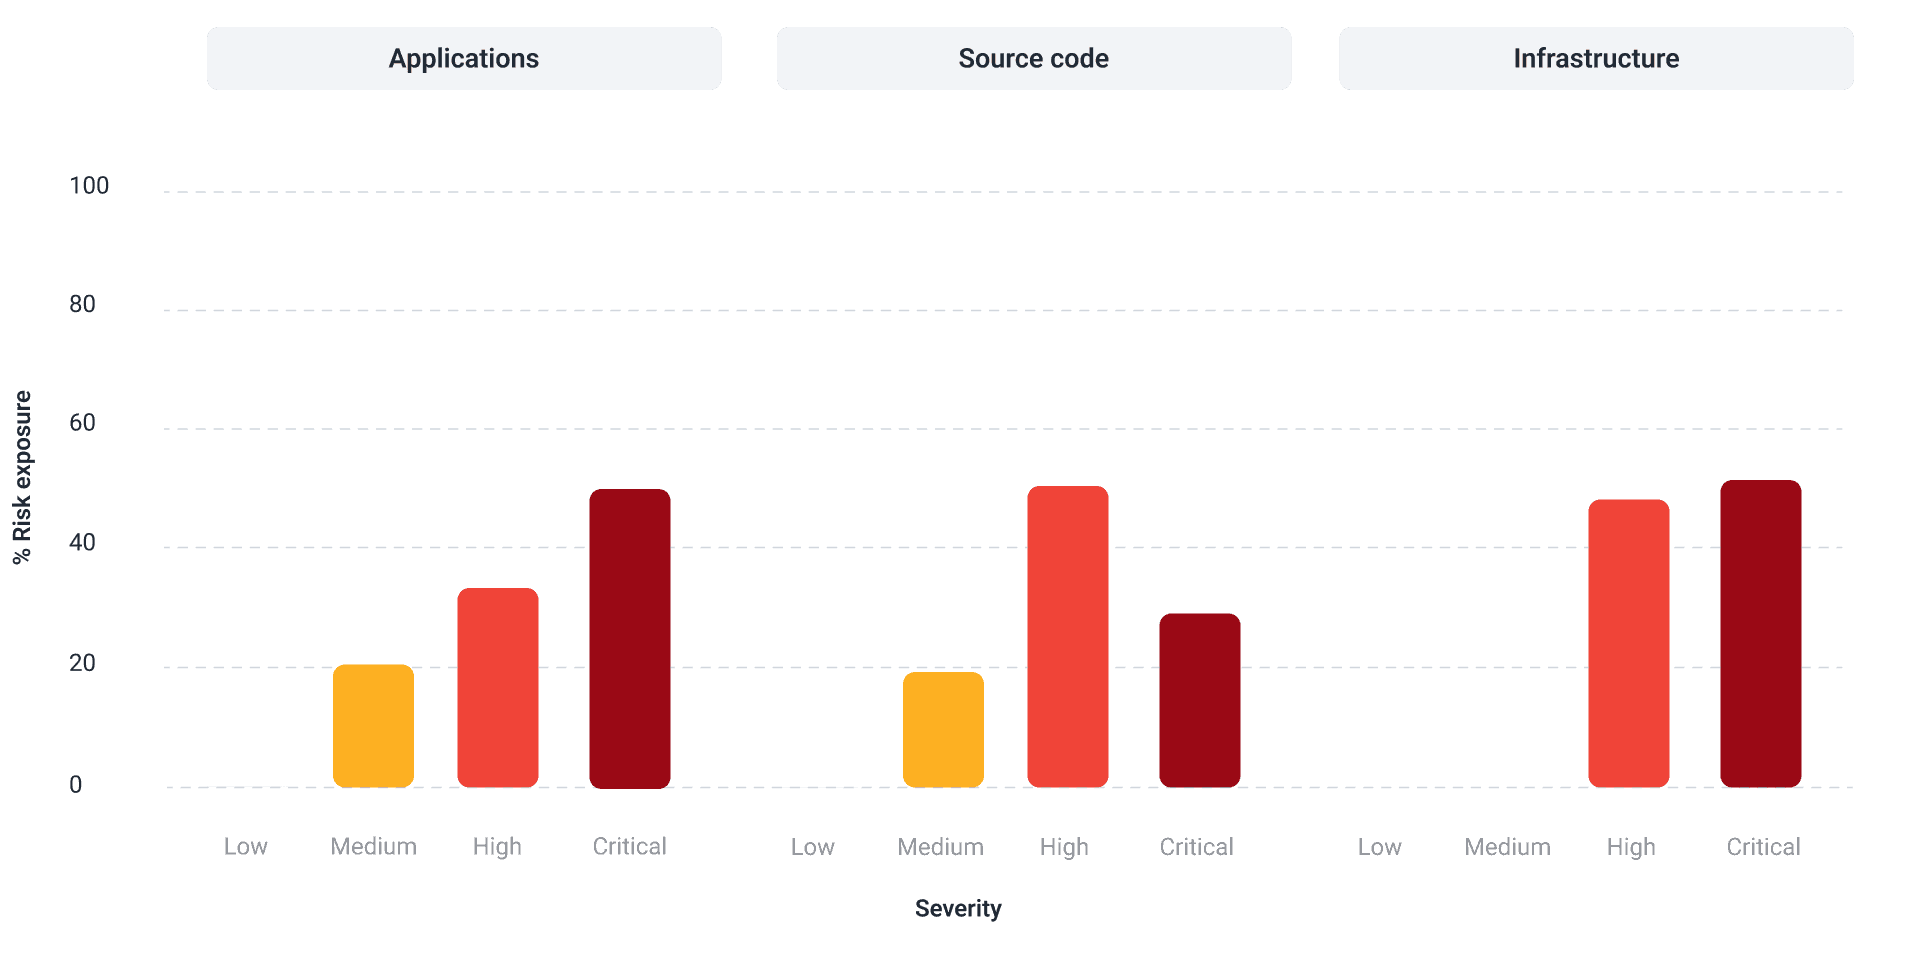

This year, the usual pattern was maintained, where the number of vulnerabilities decreases as their severity range increases. Results for infrastructure showed a slight deviation, as it did last year.
For source code and applications, our most requested targets, low- and medium-severity vulnerabilities made up 95% of all findings (97.1% for applications, 95.3% for source code). But high- and critical-severity vulnerabilities dominated risk exposure, ranging from 80% to 99% of total risk exposure across all targets, including infrastructure.
Target of evaluation
Total vulnerabilities
Total risk exposure
Source code
978,820
23,530,544.26
Application
140,551
3,903,585.51
Infrastructure
25
6,016.17
Risk exposure by detection method
55.8%
44.2%
15,302,799.63
12,137,346.3
Vulnerabilities found by our automated tools averaged 15.5 CVSSF units. Those found by our pentesters averaged 93.2 units, six times as much.
Our pentesters continue to outperform automation when it comes to uncovering risk linked to critical-severity vulnerabilities.
Note that pentester figures come exclusively from our Advanced plan, which combines testing done by AI, automated tools and pentesters. Tool figures include both Advanced and Essential (automated-only) plans.
Human expertise remains essential for thorough security assessments, even after implementing multiple tools and investing in AI. A comprehensive AppSec solution leverages all three: AI, scanners, and security experts.
Our research report "Boosting AST accuracy through pentesting" digs deeper into how manual testing catches what automation misses.
Vulnerabilities by detection method
88.4%
11.6%
But for critical-severity vulnerabilities alone, 87% were identified through manual review. As in previous years, manual techniques remain far more effective than vulnerability scanning at uncovering the most serious flaws.


SECTION 05
Top weaknesses
Key detected vulnerabilities by risk and persistence
Top 10 weaknesses
By risk exposure
"Authentication mechanism absence or evasion" topped this ranking, accounting for 19.1% of total risk exposure. Identifying these flaws enabled clients to shut down unauthorized access paths before attackers could exploit them. Together, the top 10 weaknesses contributed 68.4% of overall risk exposure.
Weakness
% Systems
Persistence
Exposure
MEx
006. Authentication mechanism absence or evasion
32.9
8,515
5,233,569.47
614.63
039. Improper authorization control for web services
47.6
10,198
2,597,472.45
254.7
184. Lack of data validation
64.5
40,060
2,134,129.46
53.27
390. Prototype pollution
53.1
41,131
1,934,665.09
47.04
034. Insecure generation of random numbers
48.3
10,197
1,687,058.57
165.45
211. Asymmetric denial of service - ReDoS
61.8
82,079
1,427,860.84
17.4
100. Server-side request forgery (SSRF)
50.1
14,266
1,207,683.75
84.65
359. Sensitive information in source code - Credentials
37.4
7,791
877,409.08
112.62
002. Asymmetric denial of service
63.1
35,530
863,976.08
24.32
441. Non-encrypted confidential information - Azure
4.8
1,789
809,671.94
452.58
Weakness: The category, while the vulnerability is the particular case with a specific location that belongs to the category
Persistence: Number of vulnerabilities identified belonging to the category
MEx: Mean risk exposure
Top 10 weaknesses
By percentage of systems
Most weaknesses in this top 10 were found in more than half of the systems. "Lack of data validation," which enables injection attacks, was the most widespread. This one is also among the top 3 in risk exposure (see above).
The listed vulnerabilities constitute 28.6% of the total. Their mean and median temporal CVSS scores mostly ranged from low to medium.
Weakness
% Systems
Persistence
MTS
MdTS
184. Lack of data validation
64.5
40,060
4.4
4.6
067. Improper resource allocation
64.5
22,086
5.1
4.9
002. Asymmetric denial of service
63.1
35,530
5.2
6.6
211. Asymmetric denial of service - ReDoS
61.8
82,079
4.1
4.6
063. Lack of data validation - Path Traversal
58.0
17,391
3.5
2.7
390. Prototype Pollution
53.1
41,131
3.7
2.7
008. Reflected cross-site scripting (XSS)
52.5
39,520
1.9
1.3
086. Missing subresource integrity check
51.1
18,303
1.1
0.6
100. Server-side request forgery (SSRF)
50.1
14,266
5.2
6.6
034. Insecure generation of random numbers
48.3
10,197
5.0
8.1
MTS: Mean CVSS temporal score
MdTS: Median CVSS temporal score
Top 5 weaknesses
Target of evaluation: source code
By risk exposure
This top 5 matches the overall top 10 for risk exposure exactly. Nearly all vulnerabilities in these categories were found in source code. They represent just over 10% of vulnerabilities in this target, yet account for 50% of its risk exposure.
"Authentication mechanism absence or evasion" was the least frequently reported weakness on this list, yet ranked first, representing 15.9% of total risk exposure.
Weakness
Persistence
Exposure
MEx
006. Authentication mechanism absence or evasion*
6,767
3,737,299.38
552.28
039. Improper authorization control for web services
9,447
2,193,541.9
232.19
184. Lack of data validation
39,358
2,112,920.67
53.68
390. Prototype Pollution
40,625
1,934,665.09
46.63
034. Insecure generation of random numbers
10,166
1,682,427.79
165.5
*Recommendation: Validate data types on the server side for all input fields in the application.
Top 5 weaknesses
Target of evaluation: application
By risk exposure
"Authentication mechanism absence or evasion" leads this top 5 as well. Together, these categories represent 43.3% of all vulnerabilities identified in applications and account for 67.9% of their risk exposure.
"Lack of data validation - Token," though fifth in the ranking, has the second highest MEx. It is when a JWT access token doesn't validate the signature, so attackers can modify the token and have their requests accepted, or even remove the signature entirely and find success.
Weakness
Persistence
Exposure
MEx
006. Authentication mechanism absence or evasion
1,748
1,496,270.08
855.99
203. Unauthorized access to files - Cloud Storage Services*
13,499
500,832.48
37.1
039. Improper authorization control for web services
754
403,933.18
535.72
333. Insecure service configuration - EC2
44,667
149,840.91
3.35
353. Lack of data validation - Token
167
100,952.83
604.51
*Recommendation: Restrict access to the system's public storage services.
SECTION 06
Vulnerability remediation
Discover remediation times and rates
All vulnerabilities
62.2%
0.9%
4.1%
49.0%
Our clients remediated nearly two-thirds of all vulnerabilities. Systems that used our CI Gate reached a 72.2% remediation rate by year's end, versus 58% for systems that didn't use it.
Cumulative remediation rates varied by severity: 38.8% for low, 51.9% for medium, 49.2% for high, and 63.8% for critical. Only 0.1% of high-severity and 0.3% of critical-severity vulnerabilities were permanently accepted—approaching the ideal target of zero.
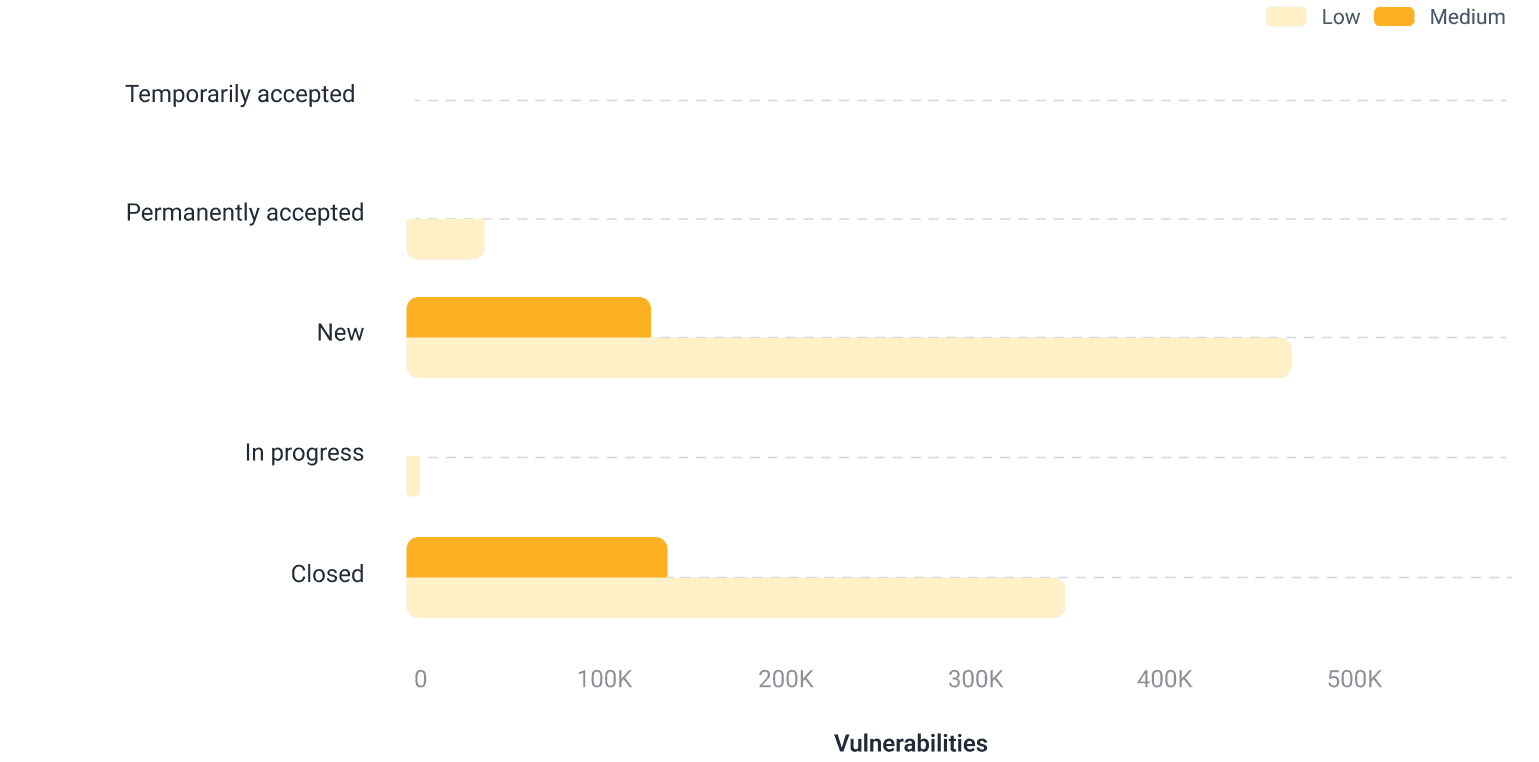
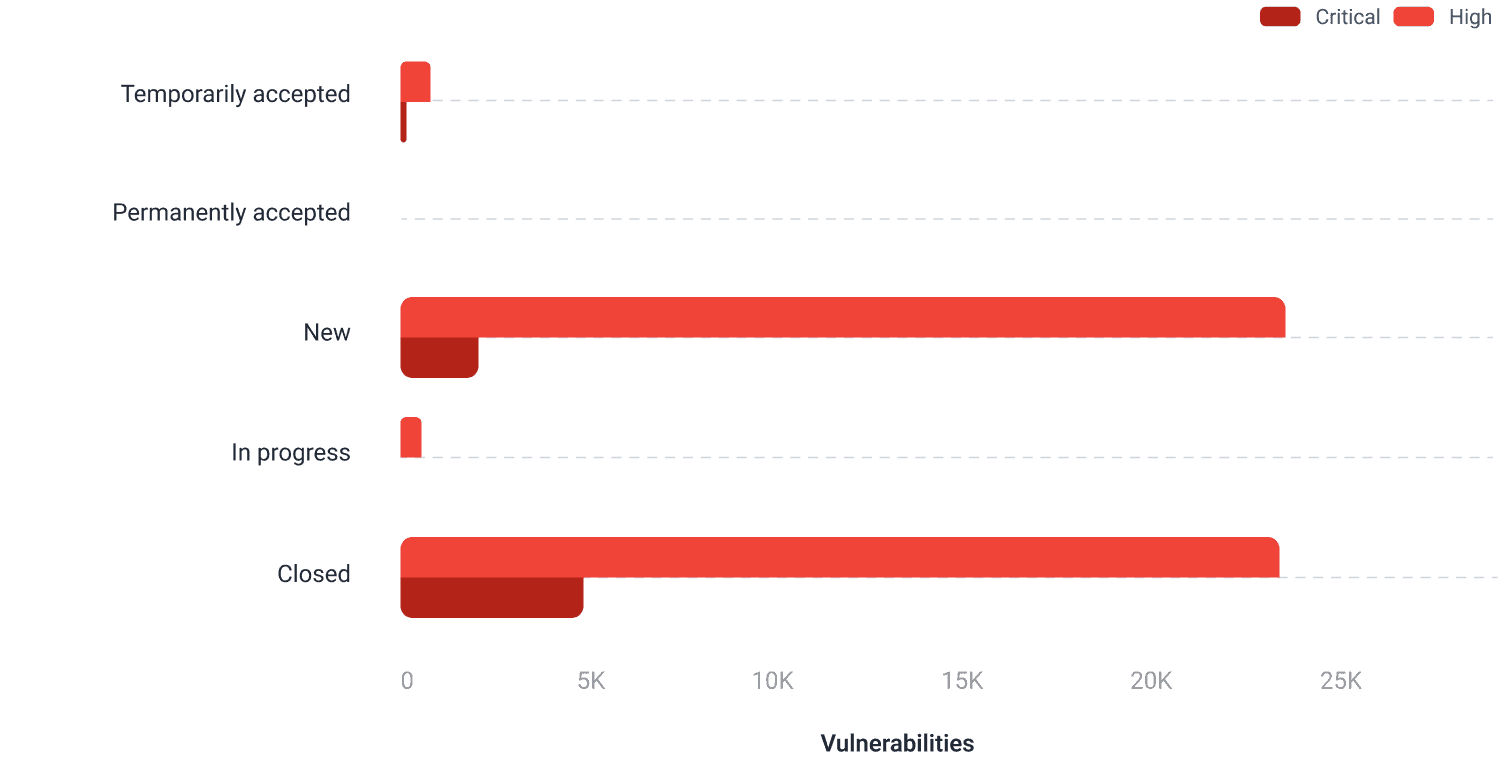
New: The organization has not yet defined treatment for the vulnerability.
In progress: The organization already has plans to remediate the vulnerability.
Closed: The organization has already remediated the vulnerability.
Temporarily accepted: The organization has decided not to remediate the vulnerability for the moment.
Permanently accepted: The organization has decided not to remediate the vulnerability.
Remediation and MCP use
We offer an MCP server that allows clients to ask AI tools questions about their security posture, including recommendations for risk mitigation. This year, it was used by 41% of our clients. Their mean remediation rate was 49.7%, which contrasts with the 24.1% rate of clients who did not use the MCP.
*We began tracking MCP use in June 2025.
Time to remediate
Median days to remediate
22
30
Comparing medians, teams remediated vulnerabilities 26.7% faster in systems that used our CI Gate (broke the build) than in those that didn't.
Ideally, higher severity means faster remediation. That's what happened: critical-severity vulnerabilities were remediated 36% (mean) and 50% (median) faster than low-severity ones.
Severity
MTTR
MdTTR
Remediated vulnerabilities
Low
56
28
312,957
Medium
51
30
135,762
High
60
40
22,045
Critical
36
14
3,581
MTTR: Mean time to remediate
MdTTR: Median time to remediate
Remediation rate over time
By risk exposure
While 62.2% of vulnerabilities were remediated, overall risk exposure dropped 55% by year's end. The remaining exposure is heavily influenced by high-risk vulnerabilities (high CVSSF values) that were still open when we closed data collection. Specifically, high-severity vulnerabilities accounted for 51% of the final unremediated exposure.

Remediation rate over time
All vs. high- and critical-severity vulnerabilities
More vulnerabilities were discovered than fixed each month.* Still, the cumulative remediation rate climbed from 11.1% to 42.4% by year's end (average: 30.2%).
The cumulative rate for high- and critical-severity vulnerabilities consistently outpaced the overall rate, trending upward as it did last year. It ranged from 12.5% at the end of January to 51.8% at the end of November (average: 36.5%).
*Methodology: We tracked cumulative vulnerabilities reported and remediated by month's end. For January, only vulnerabilities identified and closed within that month were counted as remediated. For subsequent months, any vulnerability closed that month was counted, regardless of when it was detected in 2025.

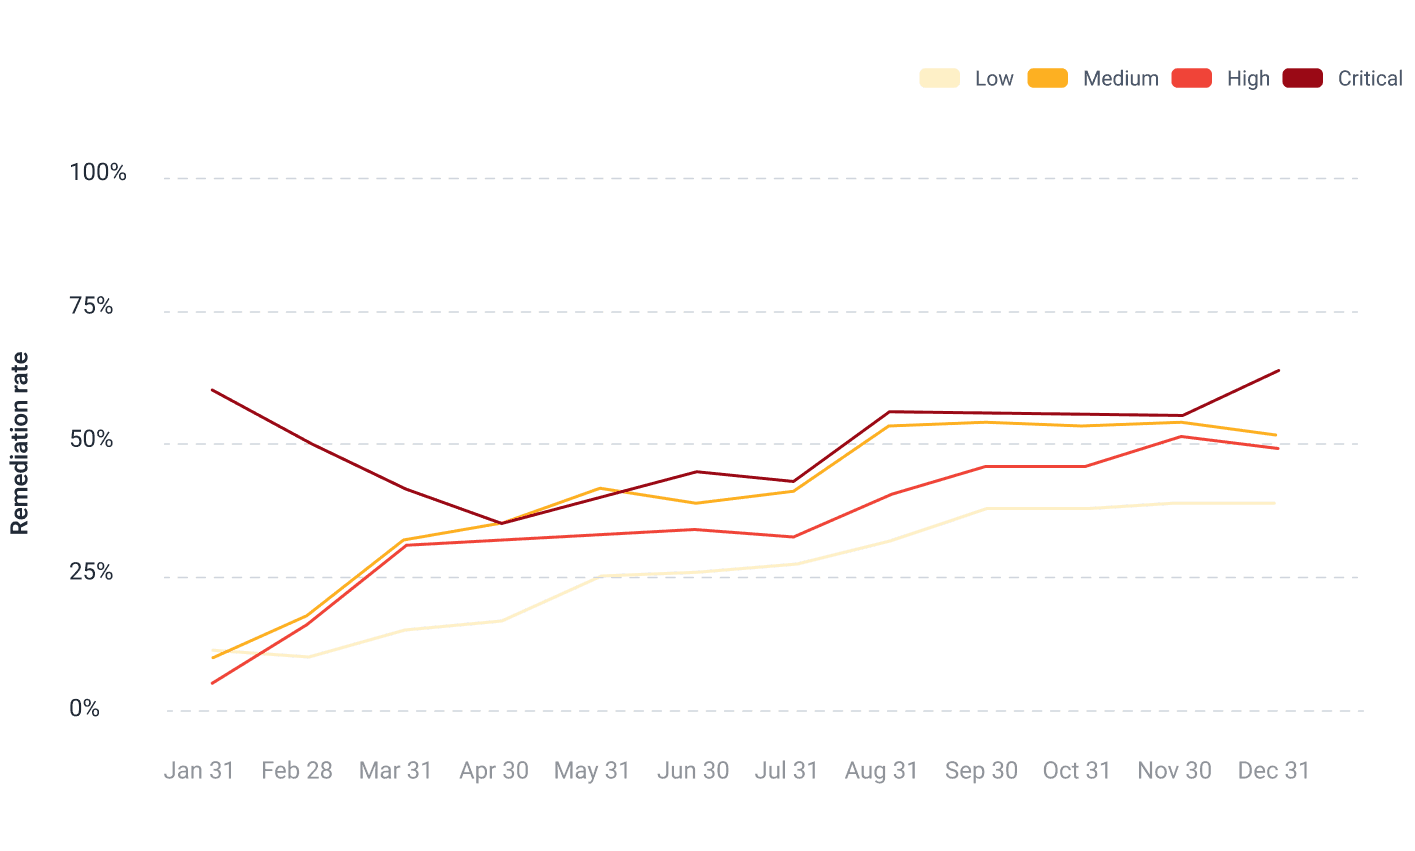
Remediation rate over time
By severity
For most of the year, cumulative remediation rates followed the expected pattern: higher severity, higher rate. Low-severity vulnerabilities had the lowest rate (average: 26.4%), and critical-severity ones had the highest (average: 50.2%). The exception to the pattern was medium-severity vulnerabilities (average: 40.3%), which outpaced high-severity ones (average: 34.7%). Also unexpected, but welcomed, was the high remediation rate for critical flaws seen in January.
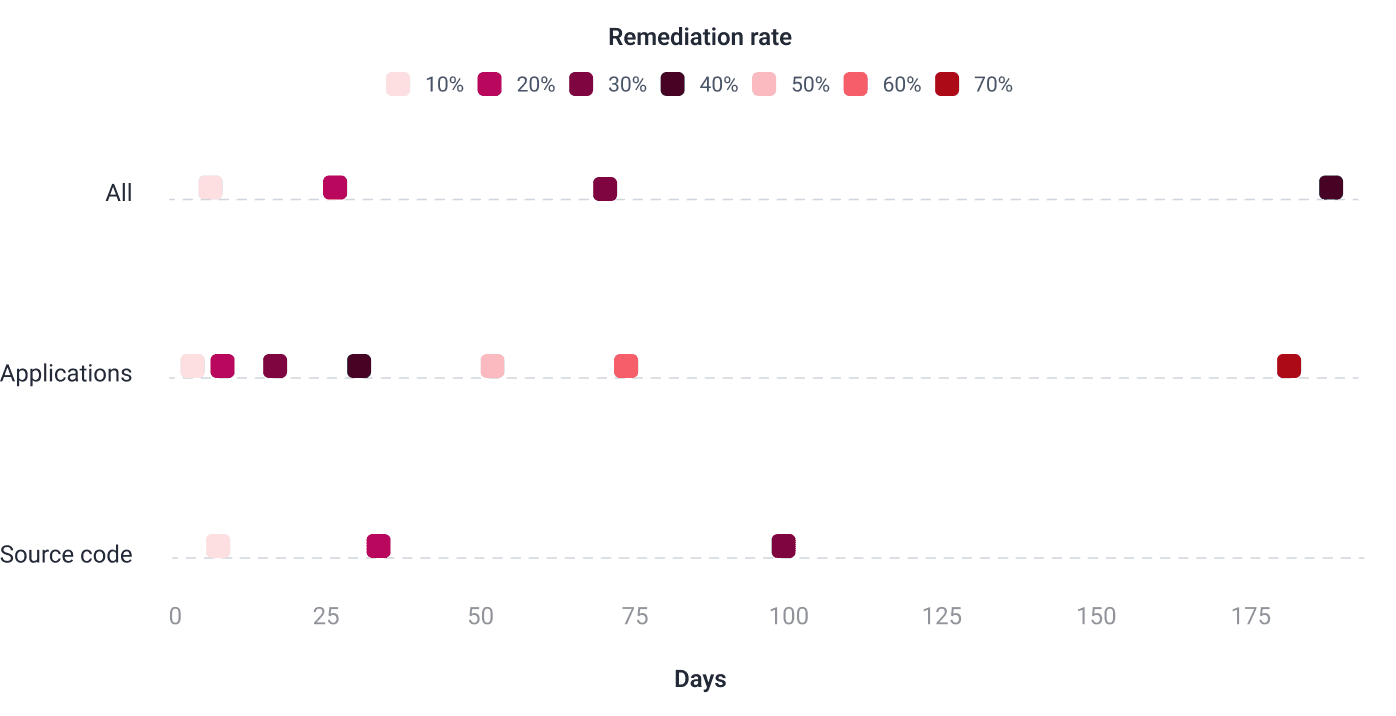
Distribution of remediation rates
By target of evaluation
We ranked vulnerabilities by remediation time, from shortest to longest, with unremediated vulnerabilities at the end. We then divided the full data set into ten equal groups (deciles).
Applications showed the fastest remediation overall. About a third of vulnerabilities in running applications were remediated in 16 days or less; for source code, reaching that 30% mark took 99 days. Applications were also the only target where at least 40% of vulnerabilities were remediated, achieved in 30 days.
Infrastructure had too few reported vulnerabilities to include in this analysis and does not appear in the chart below.
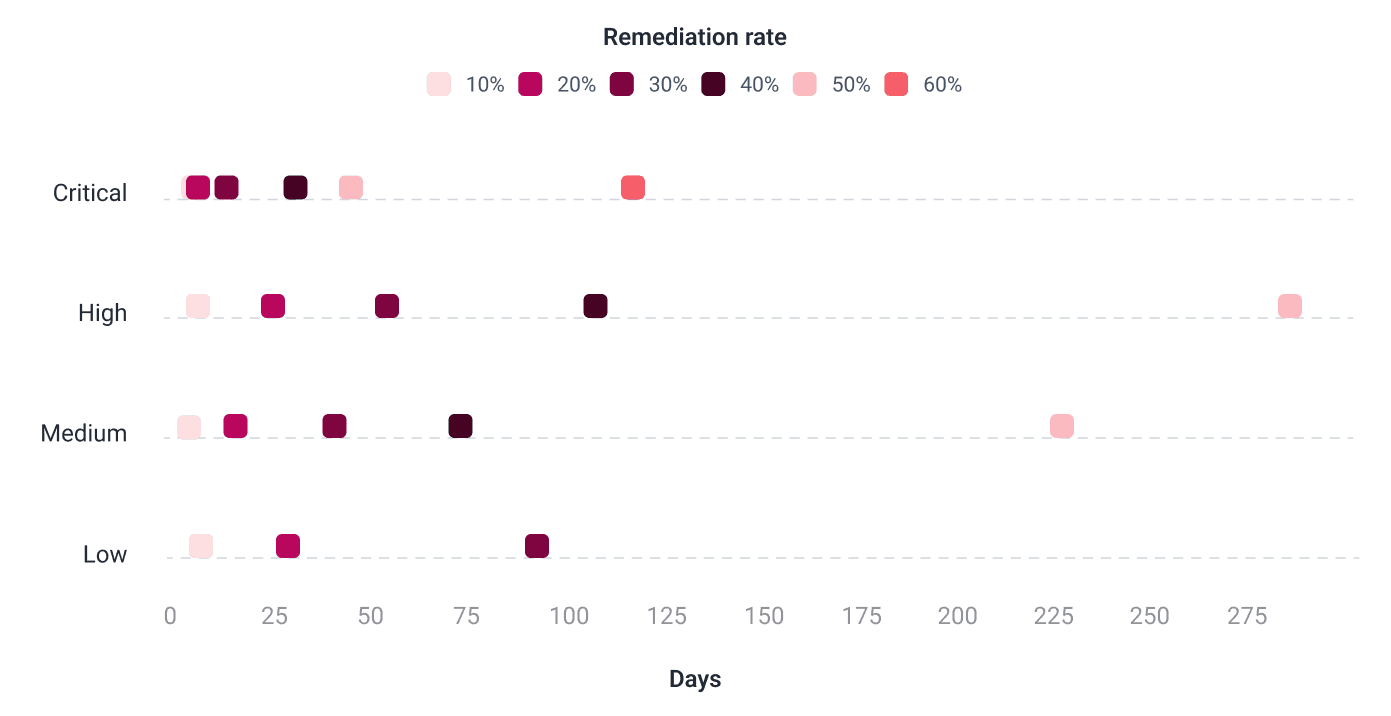
Distribution of remediation rates
By severity
Critical-severity vulnerabilities were the only ones for which remediation rates exceeded 60%. A 50% rate was completed more promptly for this group than for the medium- and high-severity vulnerabilities (45, 227, and 286 days, respectively). Low-severity vulnerabilities were the only range that did not reach a 40% remediation rate by the end of 2025.
Remediation and IDE plugins adoption
23% of our clients used our IDE plugins.* These integrate with VS Code, Cursor, and IntelliJ IDEA, letting developers see vulnerable lines of code directly and access management options like GenAI-assisted remediation and reattacks. Clients who used our plugins had a mean remediation rate of 55.4%, versus 28.1% for those who didn't.
*We began tracking plugin use in March 2025.
Remediation with custom prioritization criteria
Around 2% of our clients set vulnerability prioritization criteria in a different arrangement to the default.* This feature allows clients to customize which of the following criteria have greater weight than others: fixing cost, dependency usage (in preproduction only or also in production), transitivity, EPSS, and KEV. Clients with a custom arrangement had a mean remediation rate of 64.4%, versus 34% for those using the default.
*We began tracking customization use in March 2025.
SECTION 07
Vulnerability remediation support
Find out how much companies relied on the help of our AI and experts
53.6%
24.5%
*We began tracking Autofix and Custom Fix in March 2025.
We offer several support channels for vulnerability remediation. The main ones are Autofix, Custom Fix, and Talk to a Pentester. The first two use generative AI in the IDE extensions, platform or both: Autofix provides automatic, suggested fixes, while Custom Fix offers comprehensive step-by-step guides. Talk to a Pentester, available only on the Advanced plan, lets you schedule 30-minute calls with our pentesters to work through complex vulnerabilities.
Autofix and Custom Fix were used in more than half the systems; Custom Fix was far more common (93% of those systems). These tools were used to help with mostly low- and medium-severity vulnerabilities.
This year, assistance sessions with our experts were requested for around a quarter of the systems evaluated. Not all Advanced plan clients use this feature, even though it could help a lot to increase the remediation of critical issues, so we encourage all those not using it to try it.