Philosophy
How do you rank groups fairly in a CTF?


Chief Data & AI Officer
6 min
Reality is simpler when you don't look too closely; it is in the careful look that complexity resides. At least that was my impression when our research team at Fluid Attacks came to me to build a more appropriate mechanism for evaluating the results of our capture the flag competitions.
CTFs, in their most common form, can be individual or team-based. When they are between groups, it's usually universities, companies, or ad hoc teams who compete, and a different CTF is designed for each competition. Each event lives and dies in itself: it is competed, awarded, and the chapter is closed.
But then a natural question arises: why make a different CTF for each dimension (individual and/or teams), when in other sports—like cycling, being a purely individual competition—there are mathematical criteria that allow determining winners in different classifications within the same competition? Why not use mathematics to measure everything within a single event?
Furthermore, why not propose a longer-term competition, where the result is seen not only from an isolated CTF or stage, but from a series of stages or CTFs throughout an entire year? A kind of accumulated general classification that allows multiple dimensions of analysis: Which is the best university training hackers? Which is the best country? Which is the best company not specializing in cybersecurity? Who maintains consistency over time? Seeking to answer these questions, we began to develop the idea.
Scoring individual participants is trivial; all competitors enter the competition with the same conditions, the same information, and their results clearly reflect their performance in the competition. However, when we think about presenting rankings by groupings (countries, companies, and universities), the issue becomes more complex and certainly interesting.
The central issue of group evaluation (and of this blog post) is how to aggregate the results of participants, because, depending on the mechanism, the results can vary widely, and with them, the optimal strategies. Let's look at some of the most common approaches and their consequences.
Note: For the simulations below, I will use a scaled distribution from 0-100 based on the original scores of the 2025 edition (Fluid Attacks' CTF - LATAM Challenge).
Average
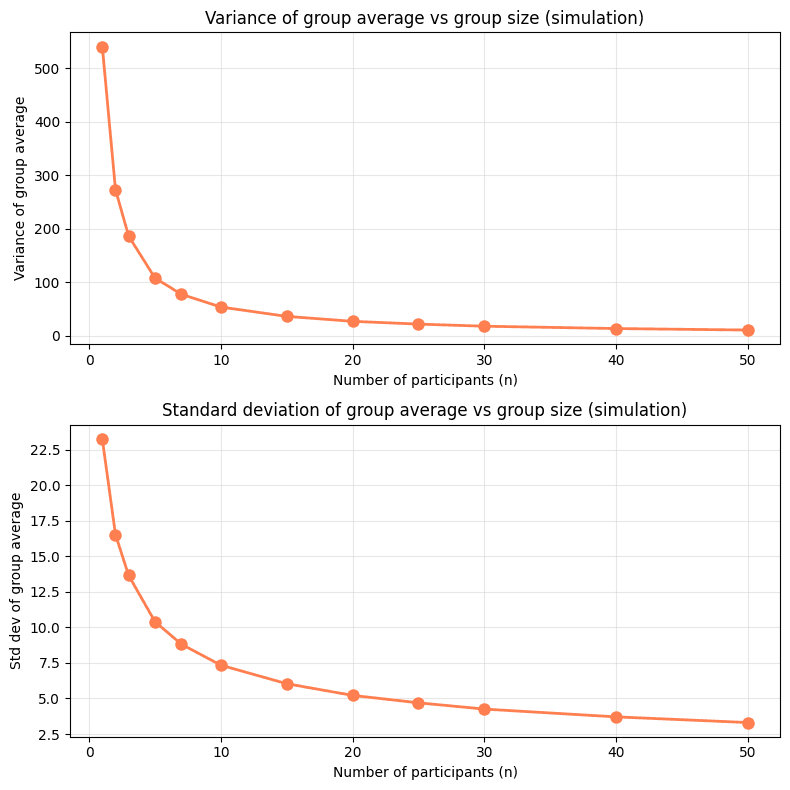
When we think about aggregations, probably the main one is the average. A side glance gives a notion of the general performance of the group and controls for the number of participants. However, a deep look reveals two problems. The first is that when the group is small, the variance is high, making it difficult to determine if the performance is representative of the group or mere chance. This problem is easy to demonstrate if we simulate groups of n participants and study the behavior of their scores:
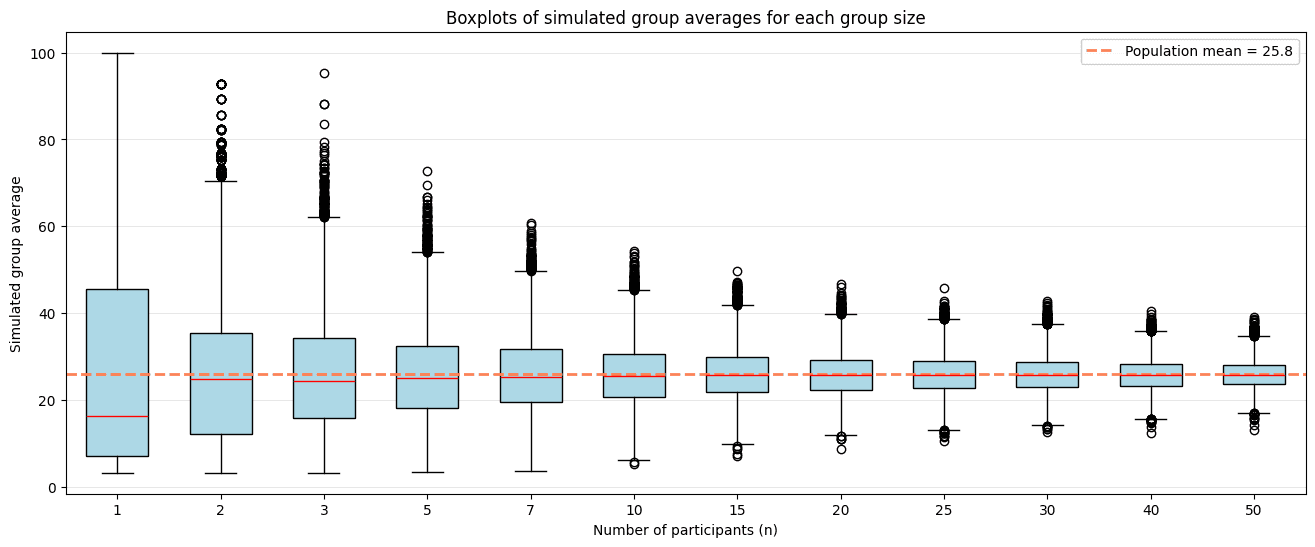
The second problem comes from the incentives it generates. The winning strategy in a scenario guided by the average is for organizations to limit their participants so that only the best can attend, leaving less experienced participants out of the competition. As event organizers, we want participation to be as broad as possible, and this principle must be reflected even in the score aggregation mechanism.
Top 3
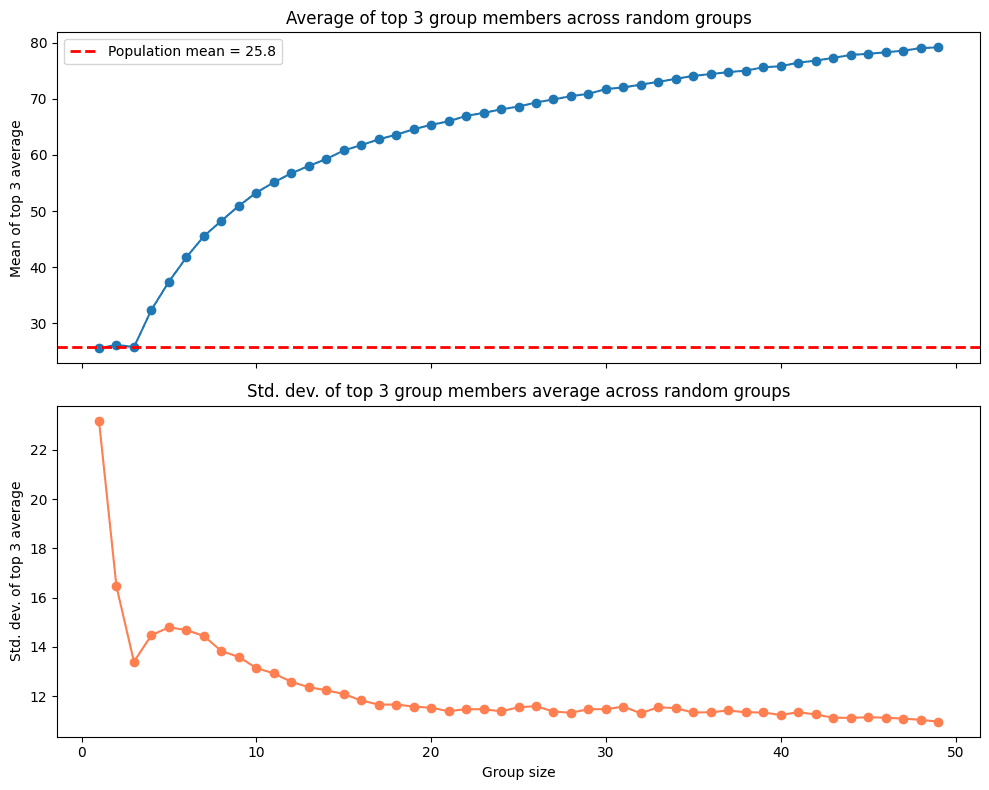
Rating the group's performance by the average of its best three participants is an alternative that does not discourage the participation of less experienced participants; however, it is not immune to problems derived from group size.
Why top 3 and not top 4 or top 5? The choice of 3 is not entirely arbitrary, but neither is it magical. Three participants allow capturing a notion of a "critical mass" of talent within the group, preventing a single outlier from defining the entire classification, as would happen with a top 1, and without requiring excessive depth that would disproportionately favor larger groups, as could happen with a top 5 or higher. It is a reasonable intermediate point between representativeness and equity. Now, what happens with groups of fewer than three members? In those cases, the average is calculated with the available participants.
With the top-3 algorithm, there are also problems. On one hand, the standard deviation is even higher than in the case of the average, generating even more uncertainty when the groups are small. Another, even more interesting problem, is that the expected score increases with the number of participants, meaning larger groups have a greater probability of having top scorers among their ranks, creating an unjustified advantage in favor of groups with a greater number of participants.
Top 3 over Expected with Bayesian shrinkage
Complex problems often require complex solutions. For this case, we seek to comply with a set of constraints derived from the approaches seen previously:
Control high variance when groups are small
Avoid disadvantages derived from having few players
Do not discourage the participation of less experienced players
Facilitate the aggregation of multiple CTFs to generate long-term rankings
The algorithm is built upon the average score of the group's best three players and applies certain refinements to comply with the mentioned constraints. The general formula is:

Sg: Average score of the top 3 participants of the groupng: Number of participants in the groupEng: Expected top-3 score for a group of sizenk: Minimum number of participants for reliable group results
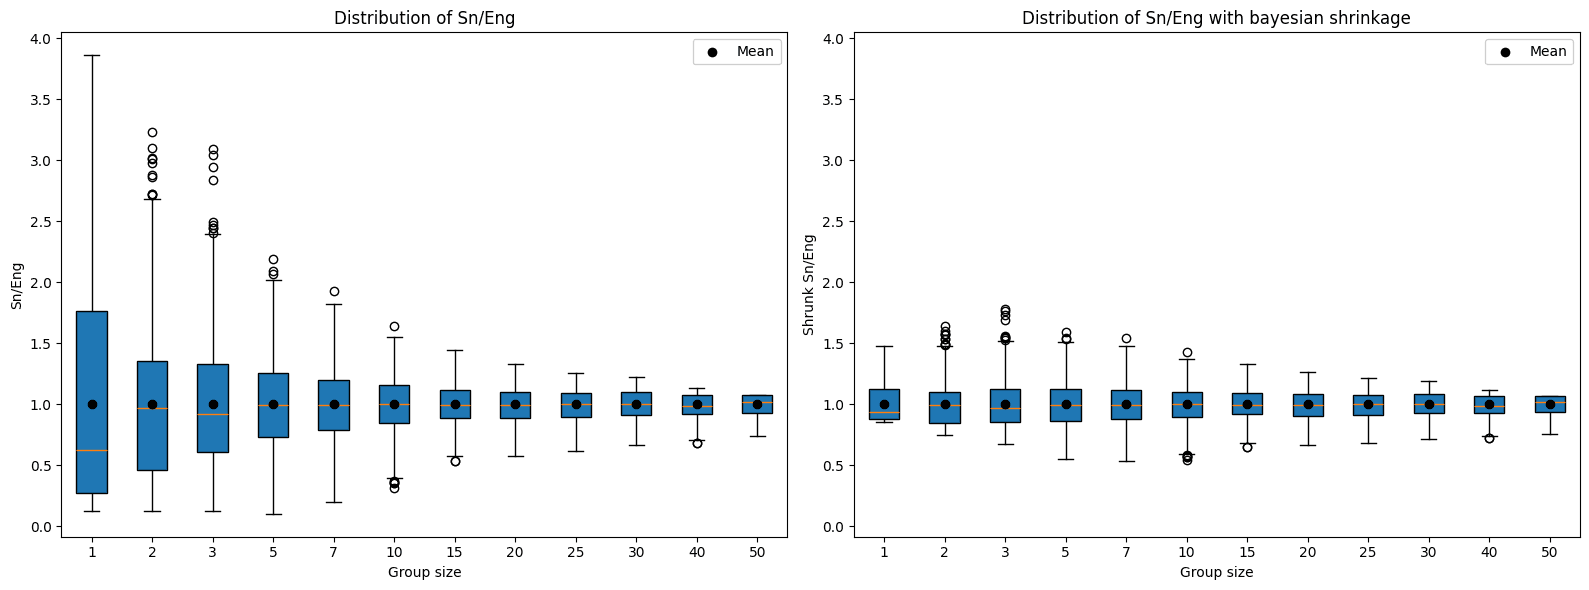
The refinement on Sg goes in two ways. The first attempts to deal with the advantage of having more participants that we stated in the previous section. For this, Eng is used with the objective of normalizing the observed score as a function of the expected score for a group of the same magnitude.
Eng is calculated by means of a Monte Carlo simulation, in which random groups of n members are formed from the CTF results list, the average score of the top 3 is calculated, and the experiment is repeated multiple times (1,000 for the purposes of this post), averaging the results.
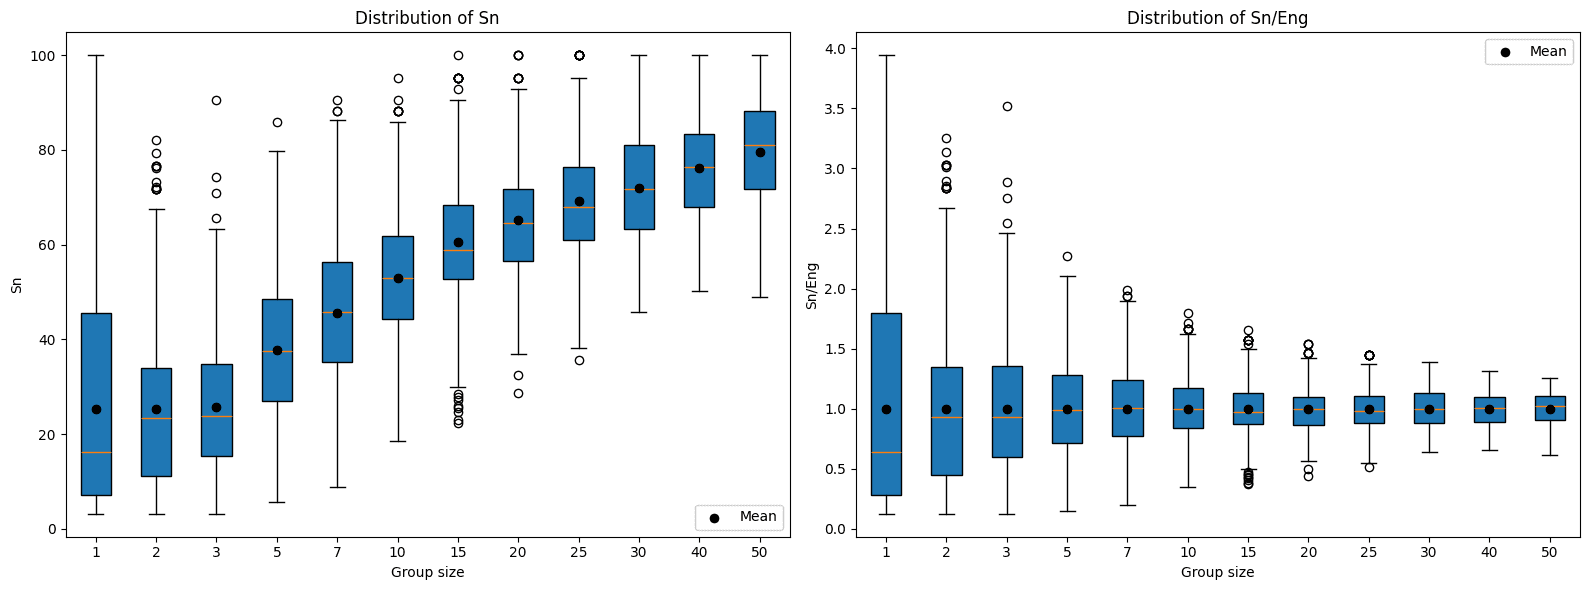
The second way attempts to deal with the uncertainty derived from having few participants. For this purpose, Bayesian shrinkage is used, which, in a few words, consists of bringing the values closer to the average when the sample is small. k is the parameter that determines the strength of the shrinkage. When n < k, as the distance increases, the attraction towards the average (which in this case is 1, due to the normalization Sg/Eng) also increases; while when n > k, increases in distance cause the force of attraction to decrease, making the impact on the score marginal. In practice, k = 5 represents a critical mass without becoming an overly demanding parameter.
Aggregation across multiple CTFs
If the intention is to build a longer-term competition, a new question arises: How are the results of several CTFs aggregated?
The most direct approach is to sum normalized scores from each event. Since the top-3 mechanism already produces a relative score (centered at 1 and adjusted for size), the results from different CTFs are comparable to each other.
The construction of a scoring system for groupings in the CTF demonstrated to us that, although the simple solution is tempting, the incentives and equity that we seek as organizers demand a more robust approach.
What began as a technical problem ended up revealing itself as a philosophical question: What does it really mean to "be the best"? Is it the flash of an isolated genius? The depth of a numerous team? Consistency over time?
The Top 3 over Expected with Bayesian shrinkage algorithm represents that necessary meeting point between statistics and the philosophy of competition. It does not pretend to eliminate uncertainty (because competing is, in essence, embracing it), but it does domesticate it enough so that the ranking reflects the true performance of the groups, regardless of their size, and promotes the participation of all.
In the end, mathematics does not replace the spirit of the CTF; it frames it. It allows us to have a single event, multiple dimensions, and a history that is written not over a weekend, but over time.

Get started with Fluid Attacks' PTaaS right now
Other posts