


| 8 min read
You cannot remediate them all in a jiffy. In today's fast-paced development cycles, the sheer deluge of reported security vulnerabilities can feel daunting. That's why you must always prioritize the vulnerabilities in your software to be remediated. Metrics such as the CVSS score and CVSSF and analyses like reachability are crucial in this prioritization task, allowing your teams to focus their time and effort on the most critical security issues first.
In recent years, such parameters have been complemented by the Exploit Prediction Scoring System (EPSS). The EPSS has emerged as a powerful data-driven approach, proving remarkably useful in cybersecurity for vulnerability management. Its ability to quantify exploitation probabilities has been so impactful that multiple companies in the industry, including Fluid Attacks, have decided to implement it in their AppSec solutions. Let's delve into what the EPSS is, how it works, and what specific benefits it brings to your vulnerability management strategy.
General definition of the EPSS
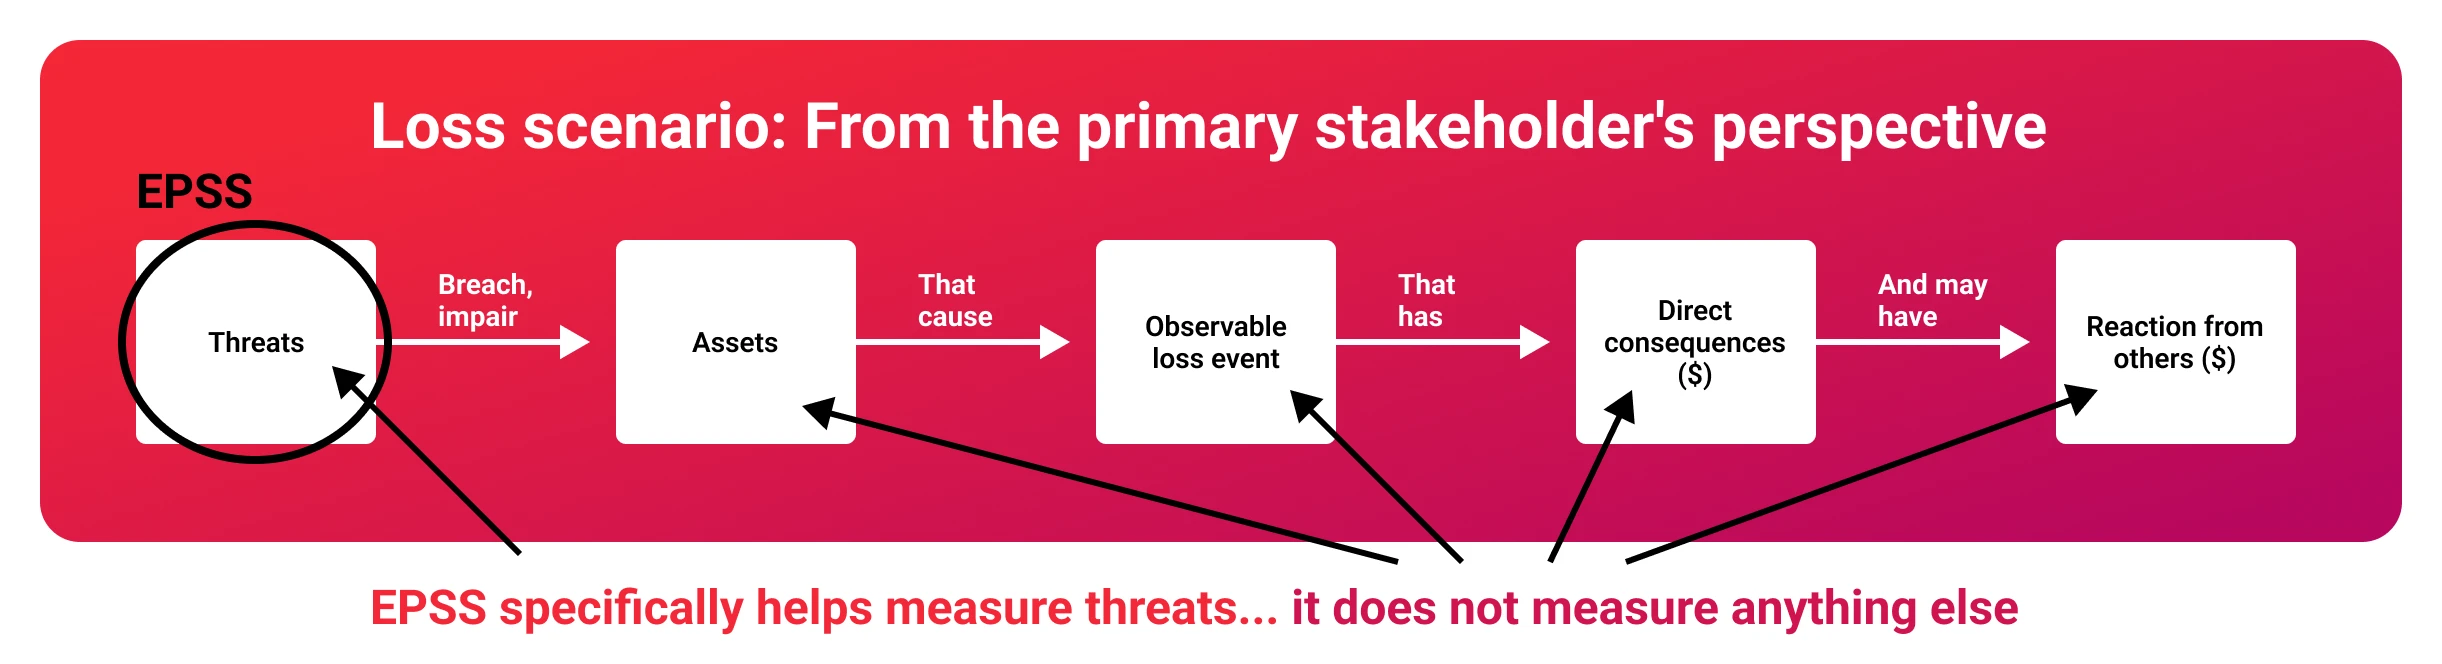
The EPSS is a machine learning model designed to estimate the probabilities of cybercriminals attempting to exploit specific, publicly known security vulnerabilities in the wild. These estimations constitute a metric that focuses on helping organizations better prioritize remediation efforts, adding a critical intelligence component to vulnerability management. Unlike severity-focused metrics, the EPSS score directly addresses the question of exploitability in "real-world" scenarios.
Managed by the Forum of Incident Response and Security Teams (FIRST), the EPSS leverages current threat intelligence from CVE (Common Vulnerabilities and Exposures) and "real-world" exploit data to generate probability scores ranging from 0 to 1 (0 to 100%; although, as FIRST notes, "EPSS is never zero"). Introduced at Black Hat 2019, with the EPSS Special Interest Group (SIG) formed within FIRST in April 2020 and its latest model update (version 4) in March 17, 2025, EPSS provides scores for all public CVEs, offering a comprehensive and continuously updated assessment of exploitation probabilities.
How does the EPSS work?
The EPSS model is trained to identify correlations and patterns between vulnerability data and observed exploit activity and provide a daily estimate of the probability that a vulnerability will be attempted to be exploited within the next 30 days. This estimation is driven by a comprehensive analysis of diverse data sources, including the MITRE CVE List, the National Vulnerability Database, Metasploit, and ExploitDB, and reports from vendors and researchers, including EPSS's data partners. Exploit activity information, for example, can be collected continuously from sources like honeypots, intrusion detection/prevention systems (IDS/IPS), and host-based detection methods. This foundational information is updated daily for each CVE, allowing the system to generate new, refined probability estimations.
The vulnerability information used by EPSS includes crucial details such as vendor (plus the popularity of the affected product), time since publication, references, associated weaknesses, CVSS metrics (a project also managed by FIRST), discussions, and public exploit code (including, for example, the date of its addition to Metasploit) and the ease to obtaining it. The system's performance is repeatedly evaluated, and adjustments are made to parameters or variable values to maximize its predictive capabilities and ensure accuracy and effectiveness.
To assess its predictive power, EPSS is trained on 12 months of historical data. Then, to simulate predicting the future, the model is tested regarding the two months immediately following that training period (also historical data). Because the model hasn't seen this "future" data, researchers can see how accurately it anticipates "real-world" exploitation activity. This process allows them to test different versions of the model and data sources, ensuring EPSS's predictions are as reliable as possible.
In addition to providing probabilities of specific vulnerabilities being exploited, EPSS also offers percentile rankings. Percentiles provide a way to order probabilities and communicate their relative importance. As Romanosky and Jacobs state in a post for FIRST, "the percentile is the proportion of all values less than or equal to the current rank." Therefore, to illustrate, if a vulnerability with an EPSS score of 0.15 (or 15%) is in the 89th percentile, this means that 89% of all scored CVEs have an EPSS score at or below 0.15 (or that this vulnerability is in the top 11%).
So, while a probability of 15% might not seem exceptionally high in isolation, the percentile ranking reveals that, relative to all other scored vulnerabilities globally, it falls among those with the highest scores. This provides a different perspective than simply looking at the 15% probability alone, further aiding the prioritization process.
Differences and correlation between EPSS and CVSS
Both the Exploit Prediction Scoring System (EPSS) and the Common Vulnerability Scoring System (CVSS) serve as valuable, publicly available tools for prioritizing vulnerability remediation. These metrics, developed and maintained through the collaborative efforts of individuals from researchers to government personnel, provide crucial insights at no cost. However, their focus diverges significantly: CVSS primarily quantifies the severity of a vulnerability based on its intrinsic properties, whereas EPSS estimates the likelihood of its exploitation by malicious attackers, thus providing a measure closer to the threat landscape.
CVSS emphasizes fundamental, relatively static vulnerability characteristics, such as attack complexity, exploit availability, and potential impact. While CVSS does incorporate temporal and environmental factors into its overall score, organizations frequently rely solely on the "Base score" due to the challenges in accurately assessing these dynamic variables. This base score, however, may not fully capture real risks.
Conversely, EPSS, while valuable, has its own limitations. It does not account for environmental factors, specific security controls, or the potential impact on an organization's unique assets. As FIRST emphasizes, "EPSS should never be treated as a risk score." Furthermore, its results are dependent on the accuracy and completeness of underlying data sources, and, of course, it provides a probabilistic estimation, not a guarantee of (non-)exploitation. Finally, it operates exclusively on vulnerabilities that have been assigned public CVE IDs.
See the original image created by FIRST here.
While both EPSS and CVSS can contribute separately to vulnerability management, they are best utilized as complementary metrics. Combining insights from both of them can significantly enhance vulnerability prioritization.
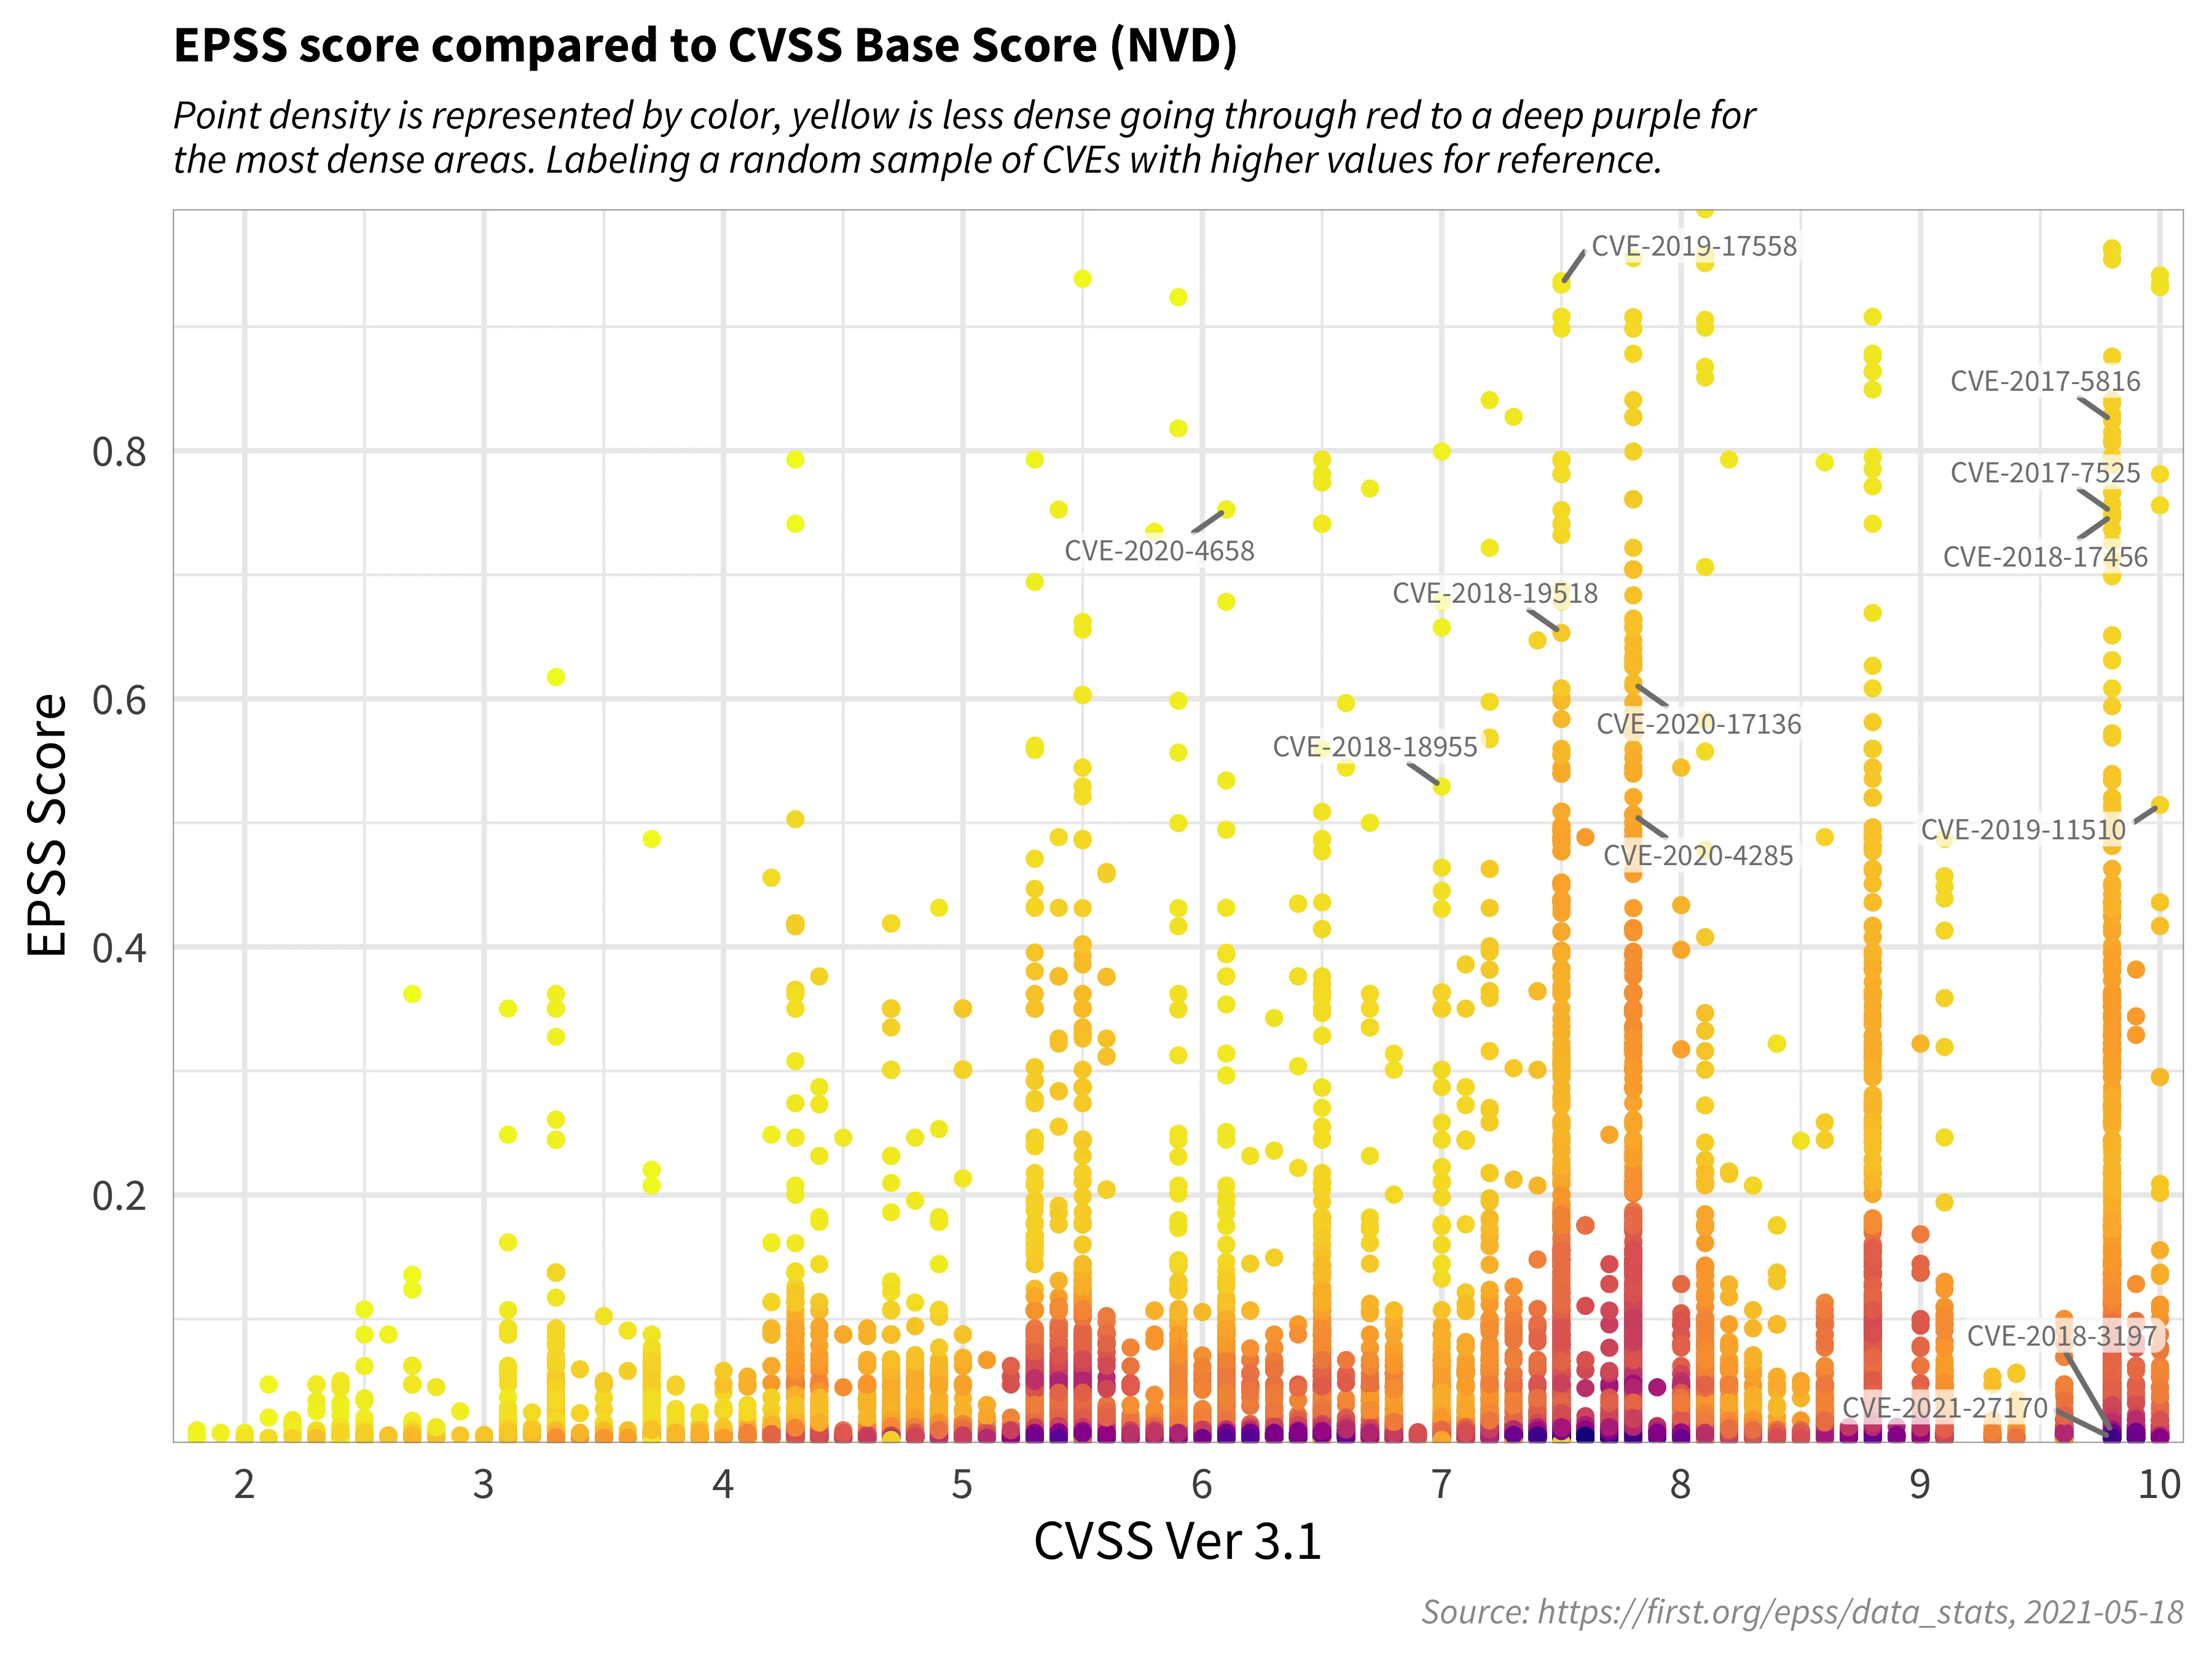
As an example taken from the EPSS User Guide, the chart above illustrates how most vulnerabilities by mid-2021 clustered near the bottom of the graph, while only a small fraction had EPSS scores exceeding 50%. This suggests that threat actors don't exclusively target vulnerabilities with high severity and impact, challenging the common notion that they solely exploit the most severe issues. In terms of prioritization:
-
The vulnerabilities at the bottom left of the graph should be the lowest priority.
-
Those at the top left have a high probability of exploitation but may not individually have a significant impact (though it's crucial to remember they can be components of chained attacks).
-
Vulnerabilities at the bottom right, while having very high impact, at that time show low probabilities of exploitation, but they warrant close monitoring for changes.
-
Crucially, vulnerabilities in the top right quadrant are the highest priority for remediation, as they exhibit high scores in both metrics.
Focusing on the top-right quadrant enables development and security teams to direct their resources primarily toward vulnerabilities that pose the most immediate and significant risk. This approach allows for resource optimization by avoiding the immediate remediation of high-severity vulnerabilities that are highly unlikely to be exploited. While critical severity vulnerabilities should always be addressed, those with a low EPSS score should not take precedence over those with a high EPSS score.
Performance of the EPSS model
To evaluate the performance of the EPSS model in contributing to the prioritization of vulnerabilities, researchers employ several key analysis metrics. The first metrics categorize vulnerabilities based on their prioritization and exploitation status using the following definitions:
-
True Positives (TP): Vulnerabilities "correctly" prioritized because they were exploited.
-
False Positives (FP): Vulnerabilities "incorrectly" prioritized because they were not exploited.
-
False Negatives (FN): Vulnerabilities "incorrectly" delayed (not prioritized) because they were exploited.
-
True Negatives (TN): Vulnerabilities "correctly" delayed (not prioritized) because they were not exploited.
Based on these categories, three crucial metrics are determined: effort, efficiency, and coverage (the latter two being analogous to precision and recall, respectively, in F-scores).
Effort measures the proportion of vulnerabilities that are prioritized. Efficiency assesses how effectively resources were used by measuring the percentage of prioritized vulnerabilities that were actually exploited. This is calculated as:
Efficiency = TP / (TP + FP)
For example, you could have 100% efficiency if all your prioritized vulnerabilities were within the set of exploited vulnerabilities.
Coverage considers the percentage of exploited vulnerabilities that were given priority. This is calculated as:
Coverage = TP / (TP + FN)
Following the previous example with 100% efficiency, if the set of exploited vulnerabilities was much larger than the set of prioritized vulnerabilities, the coverage would be low. Ideally, both sets would have an exact overlap.
Higher coverage implies greater effort and often results in lower efficiency. Improving efficiency would decrease effort but usually represents lower coverage. The goal is always to find an improved prioritization strategy.
Example
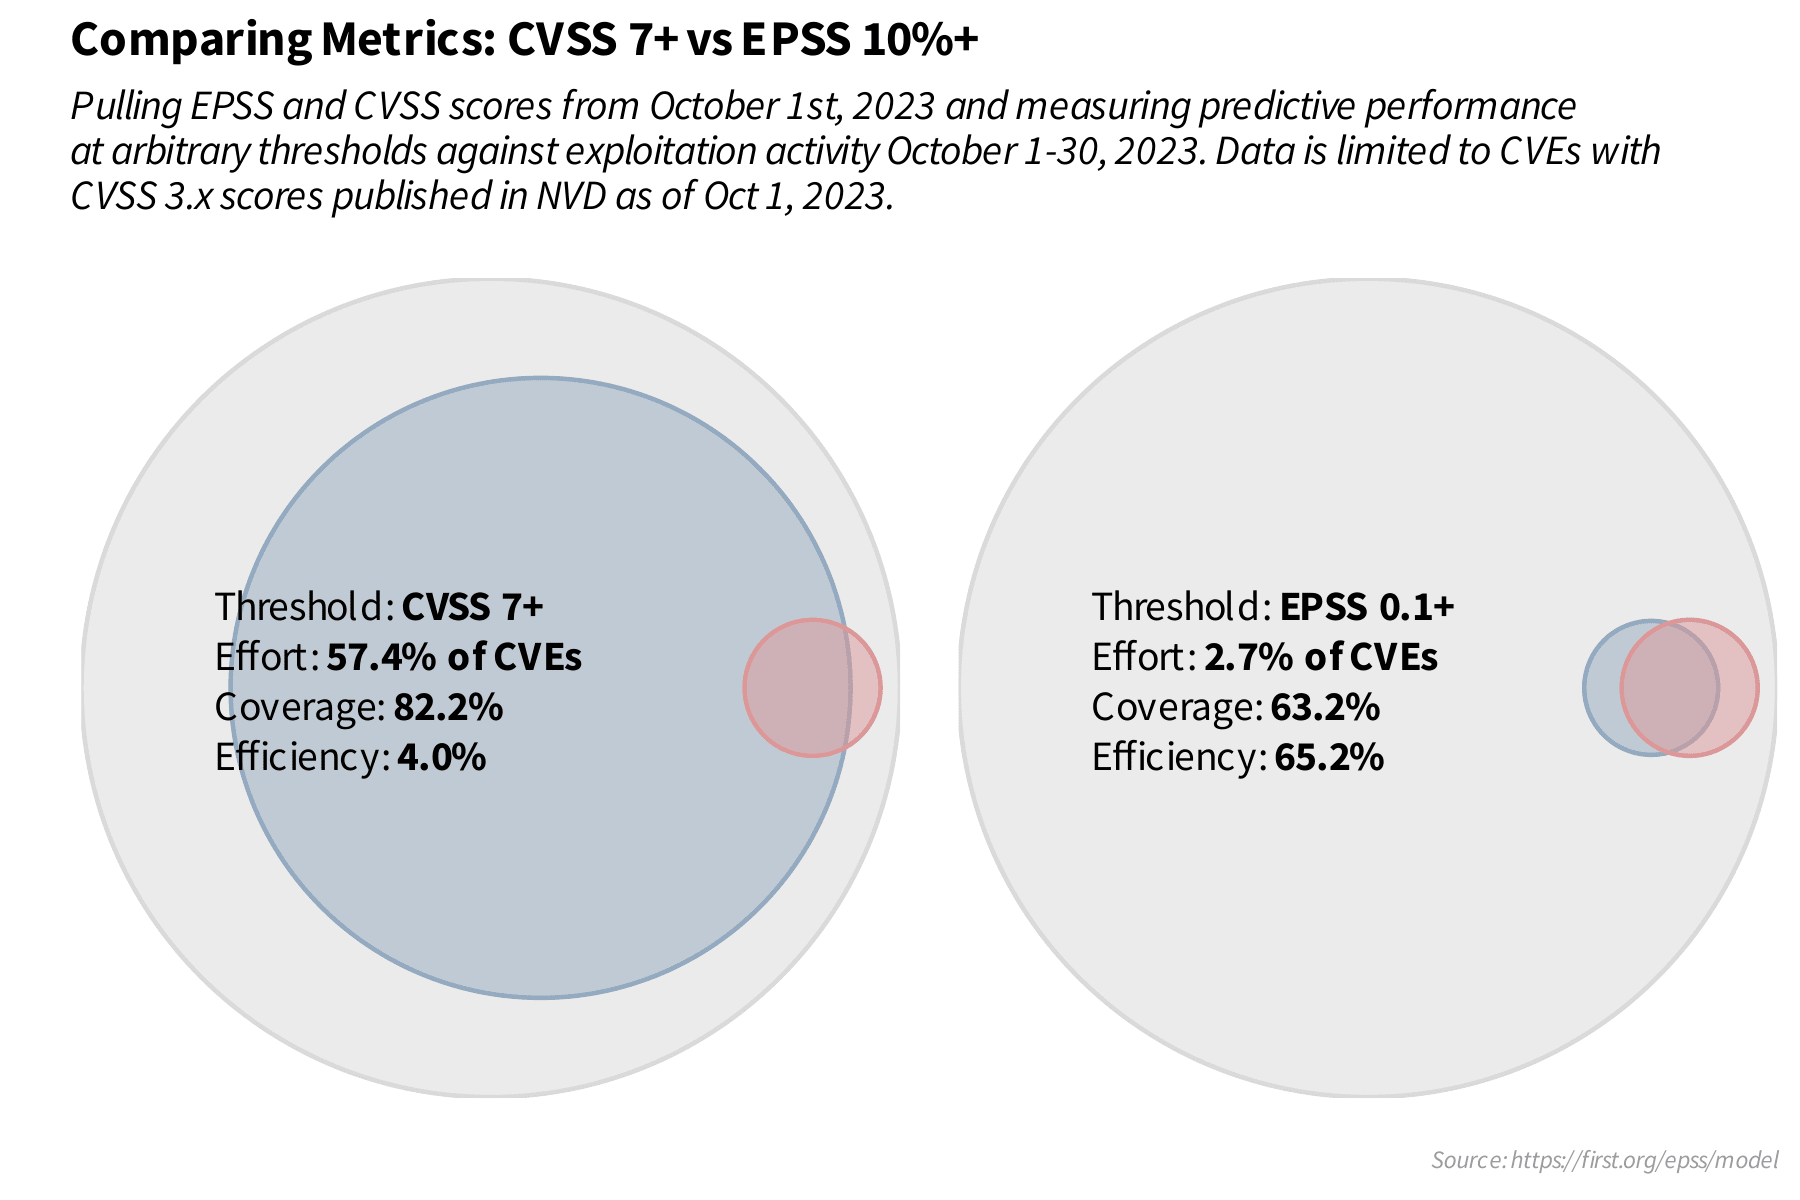
To illustrate the practical application of these metrics, let's briefly examine an example provided by FIRST. The authors chose to prioritize vulnerabilities with a CVSS base score of 7 or higher — a seemingly reasonable decision. They then noted that approximately 2.8% of the over 139 thousand recorded vulnerabilities showed evidence of exploit activity.

Upon reviewing the data in this chart, it's evident that the number of FP was significantly higher than the TP, indicating a substantial number of incorrectly prioritized vulnerabilities. Furthermore, even with a broad prioritization strategy, FN still occurred, meaning some exploited vulnerabilities were missed.
Next, the authors compared these results with what they would have obtained in the same scenario and evaluation period using the EPSS score. They selected an "arbitrary" threshold of 10% or higher for prioritizing vulnerabilities, yielding the following results ("arbitrary" because they emphasize that there isn't a universally applicable threshold; rather, it depends on each organization's risk tolerance and available resources):
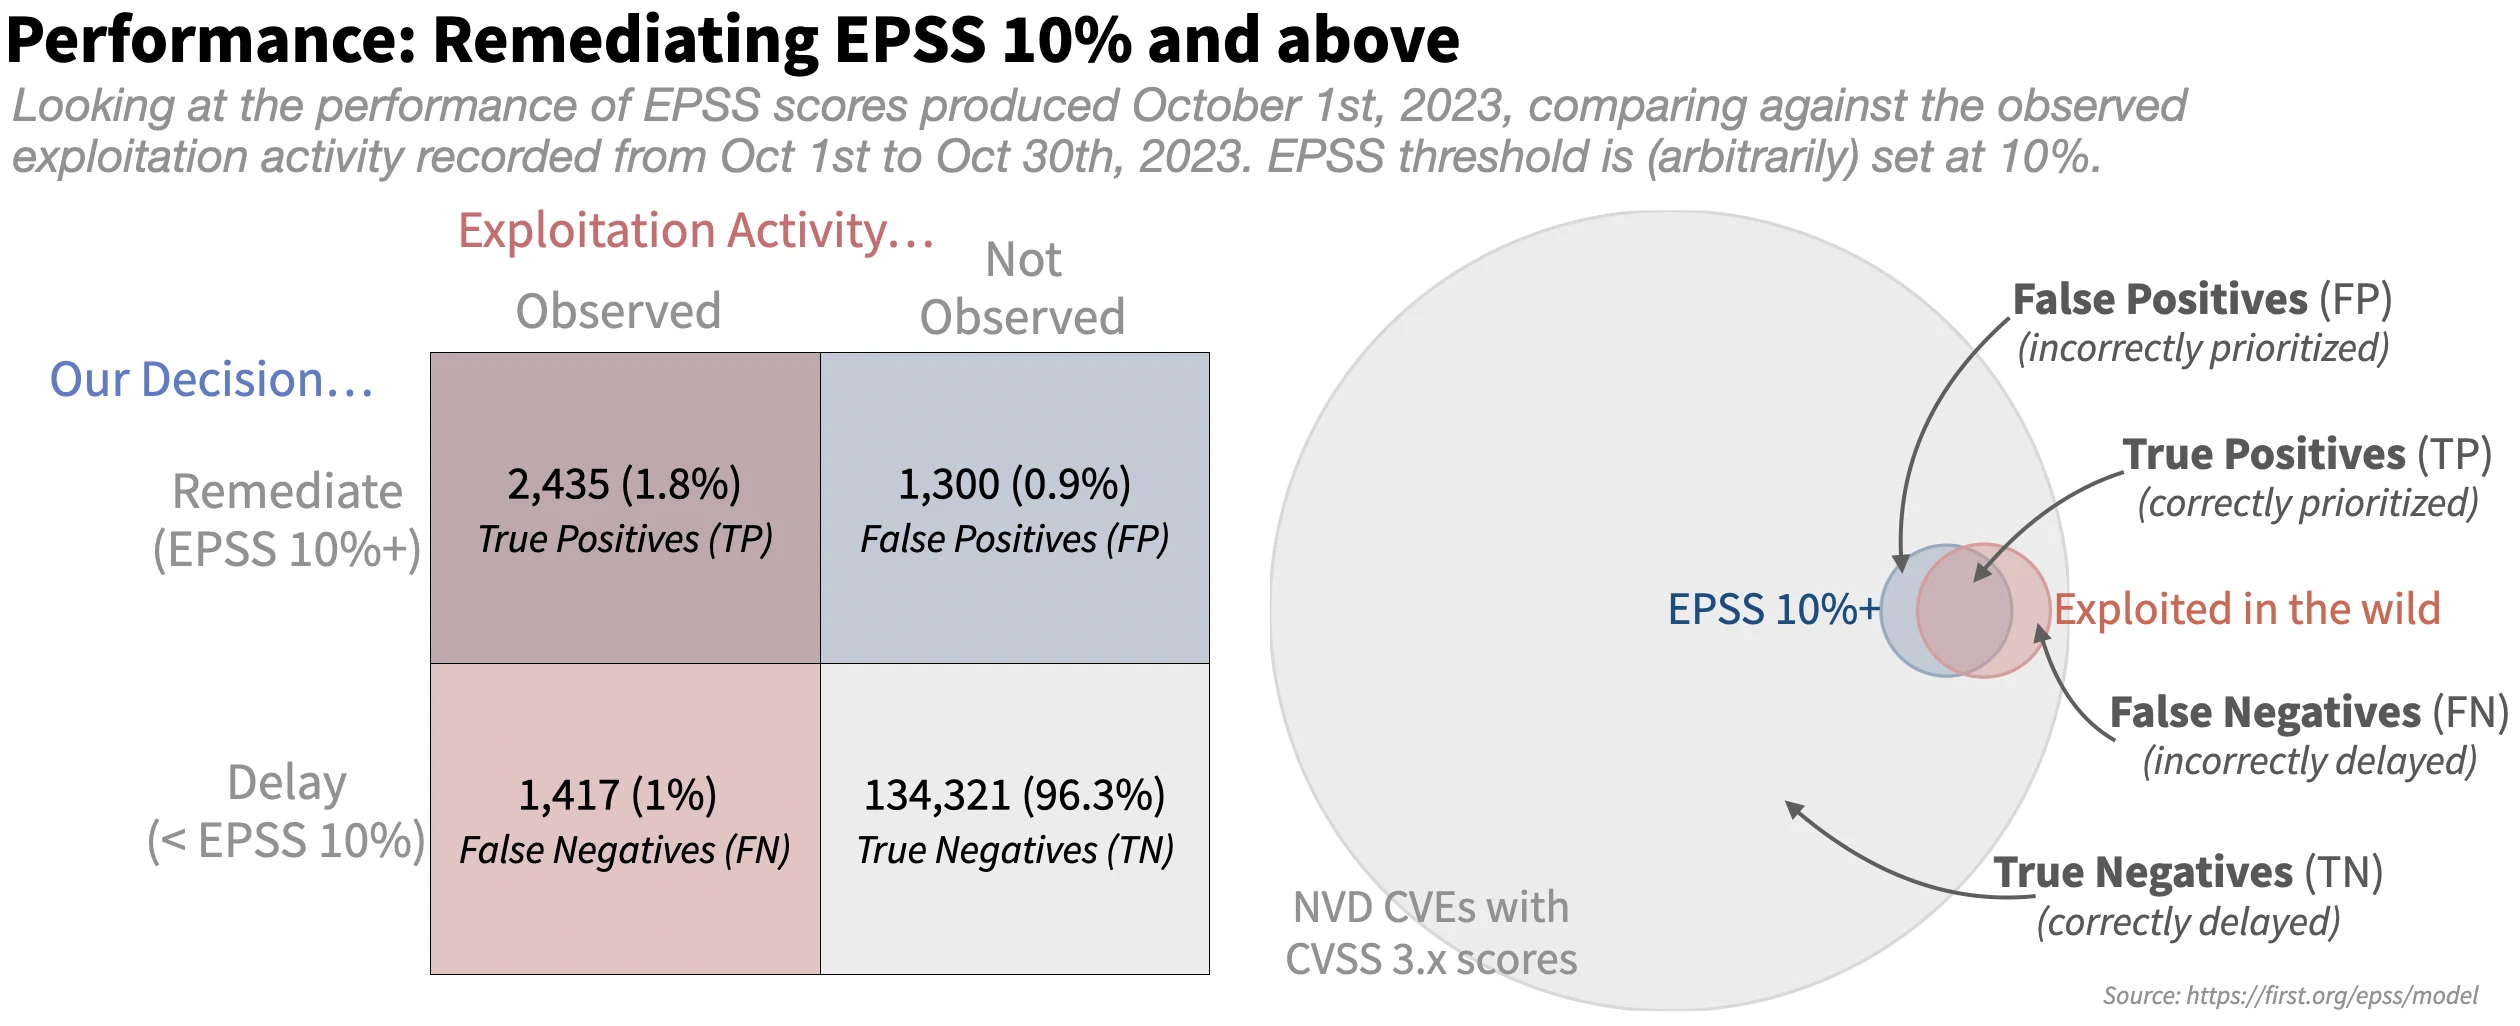
In this case, the significant number of TN or correctly delayed vulnerabilities is immediately apparent. Additionally, the difference between FP and TP is less pronounced than in the CVSS-based scenario. This translates to a remarkably reduced effort and higher efficiency with the EPSS-based prioritization strategy. This is further illustrated in the following chart:
As FIRST suggests, organizations with limited resources might prioritize efficiency over coverage. Conversely, those with fewer constraints may opt for greater coverage, even at the cost of lower efficiency and higher effort. A key takeaway is that research by this community indicates organizations, on average, remediate between 10% and 15% of their vulnerabilities per month.
Benefit from the EPSS within the Fluid Attacks platform
FIRST recognizes Fluid Attacks' vulnerability management platform for integrating and supporting EPSS. This implementation provides our clients with enhanced, new-data-driven security insights. In today's complex threat environment, a comprehensive security strategy demands centralized visibility into vulnerability findings, encompassing CVSS, EPSS, reachability analysis, and more — all of which our platform properly incorporates.
We understand that effective vulnerability prioritization goes beyond severity ratings. By combining CVSS and risk exposure (CVSSF) data with reachability analysis, you can pinpoint exploitable and dangerous vulnerabilities present in your products. Now, with the direct integration of EPSS scores, you gain additional critical insight into the short-term probability of exploitation, allowing you to mitigate the most pressing threats proactively.
Join Fluid Attacks to enhance your remediation prioritization and maximize resource efficiency dramatically. Our comprehensive ASPM solution, spanning your entire SDLC, provides the data-driven intelligence you need to stay ahead of evolving cyber risks. Contact us today and take the first step towards a more resilient and secure organization.
For more information on the EPSS
To learn more about the Exploit Prediction Scoring System, visit the official website. There, FIRST also offers, for instance, a data and statistics page with daily updates on CVEs, including those with high EPSS scores recently published and those with significant score changes. Moreover, FIRST provides a public JSON API for direct EPSS score calculations, allowing you to retrieve probability scores by inputting CVE numbers.
Recommended blog posts
You might be interested in the following related posts.